The Bitcoin price today is struggling to stay above the $105,000 mark after rejecting lower support near $104,200. The latest daily structure shows BTC trapped in a corrective flag formation, while the broader trend remains intact above key higher-timeframe Fibonacci levels.
What’s Happening With Bitcoin’s Price?
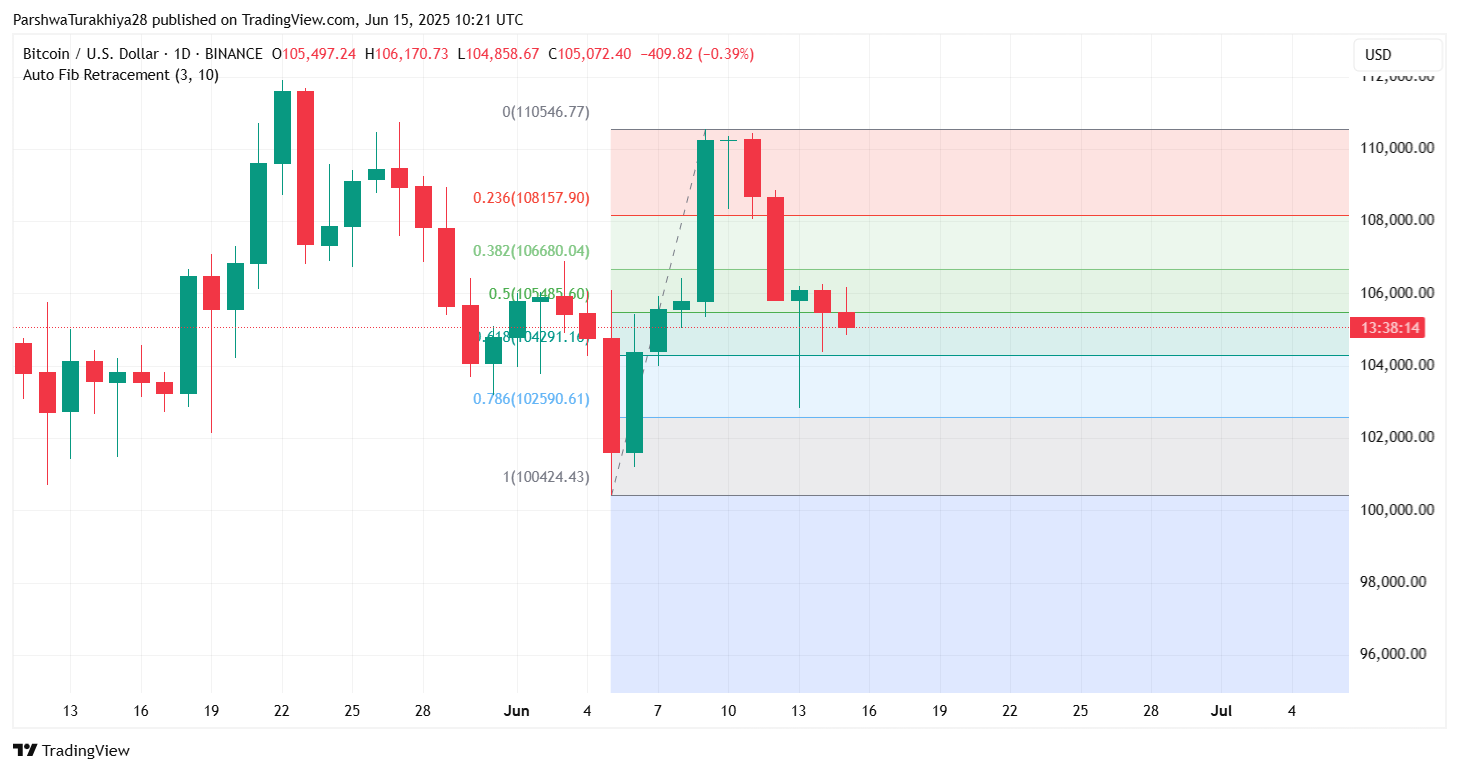
Following the June 13 breakdown below $106,000, the Bitcoin price has been consolidating in a narrowing range, with resistance at $106,000 and support at $104,000. On the daily chart, BTC is sitting at the 0.5 Fibonacci retracement level ($105,485), trying to form a higher low above the 0.618 zone near $104,291. Price action remains neutral, though the latest candles suggest indecision.
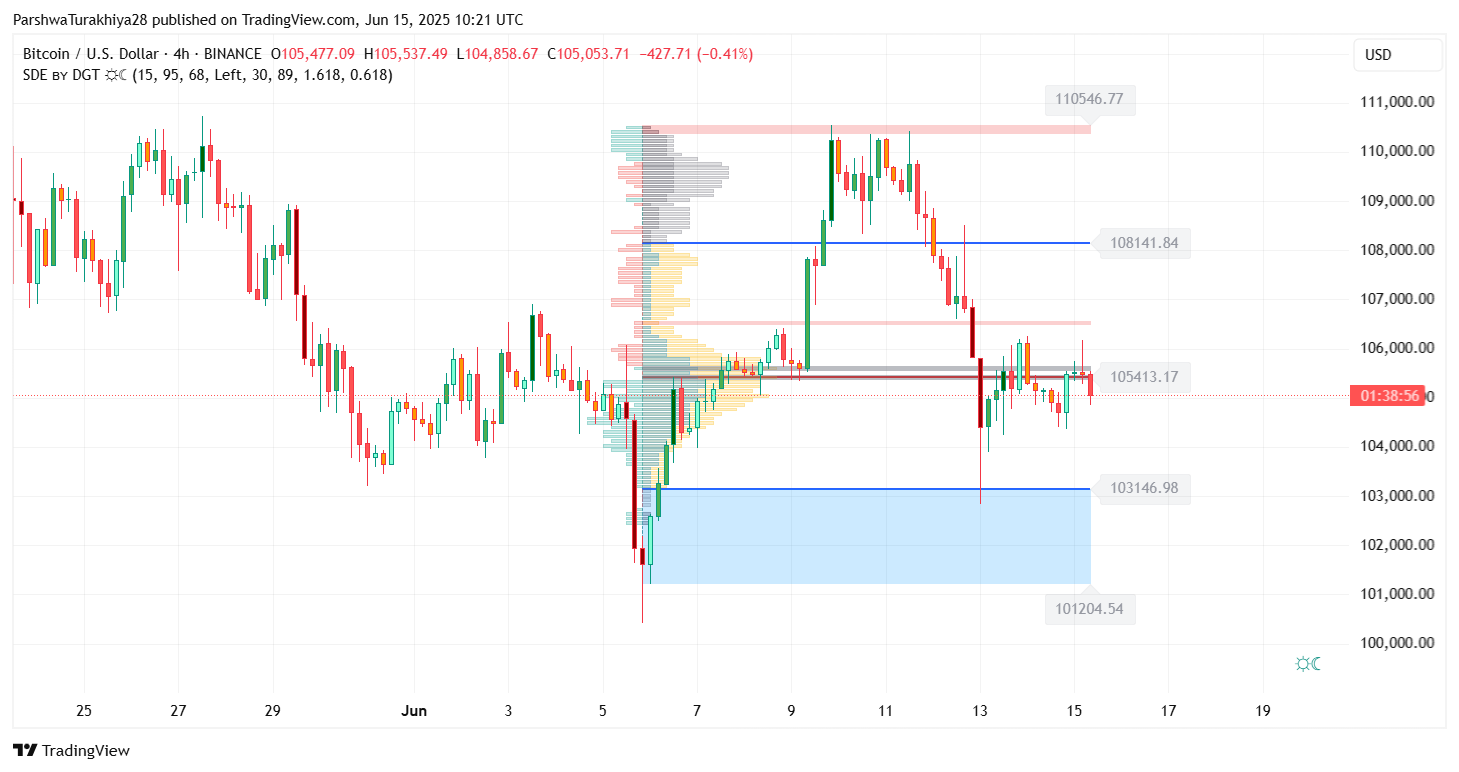
The 4-hour chart shows BTC bouncing within a micro-channel, caught between demand at $103,150 and resistance near $105,400. The volume profile indicates major interest clustered between $104,200 and $105,800, where Bitcoin has been ranging throughout the week.
Bitcoin Price Action Faces Resistance From Cloud and EMA Cluster
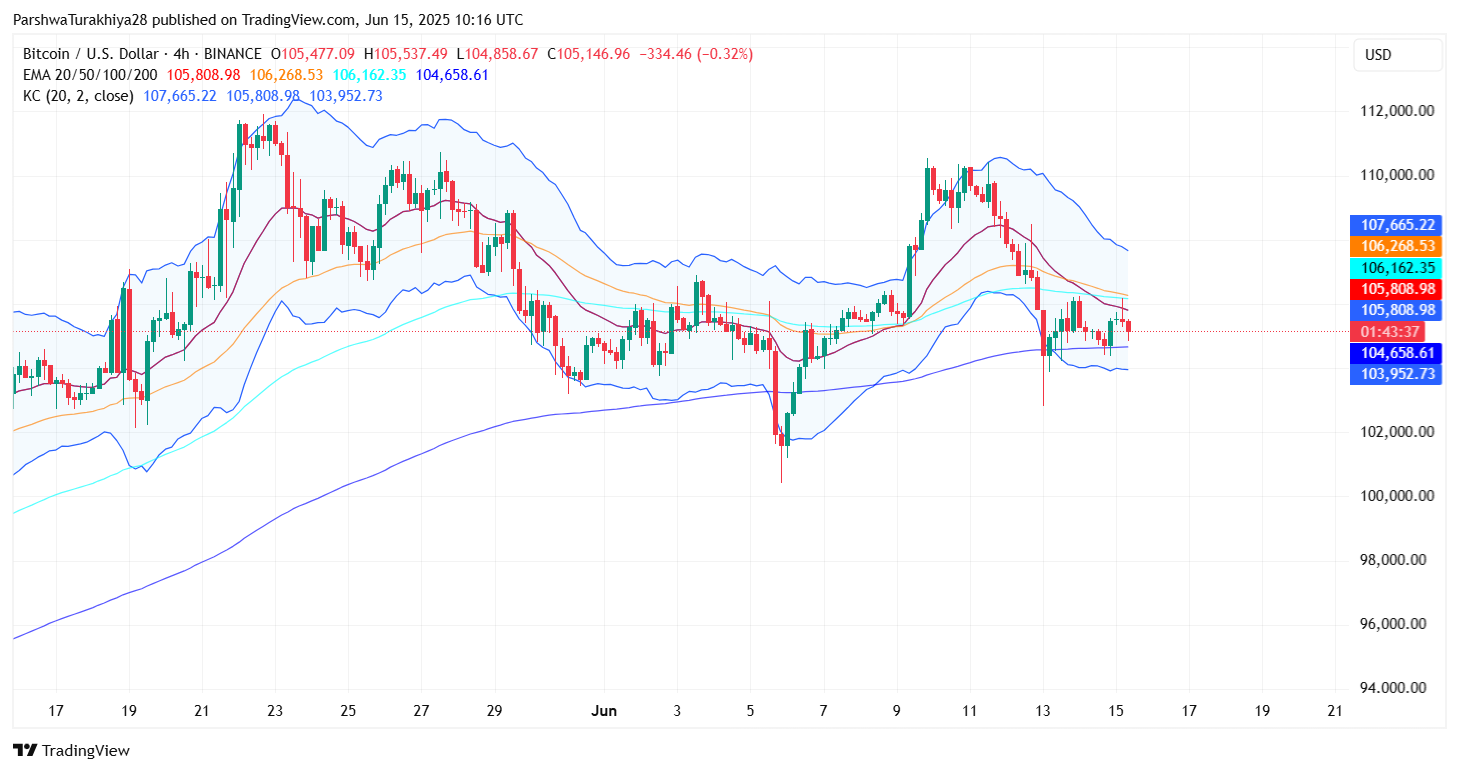
BTC continues to struggle below a critical confluence zone formed by the 20/50/100 EMA band and the Keltner Channel midline on the 4-hour timeframe. The Bitcoin price action faces supply between $105,800 and $106,300, which also aligns with the flat Tenkan-Sen and Kijun-Sen from the Ichimoku Cloud.
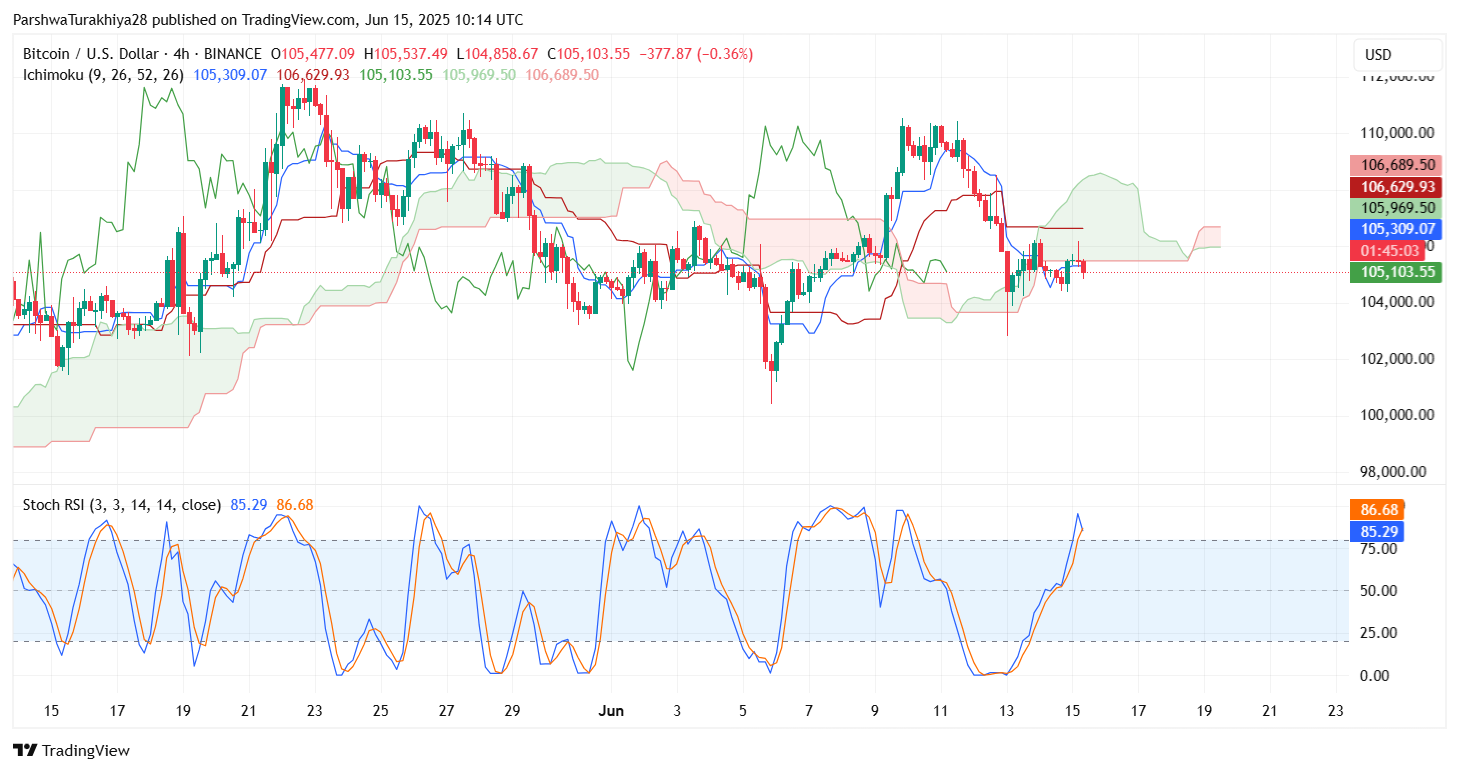
Stochastic RSI is currently hovering near the overbought zone (85–86), which signals potential exhaustion. Unless BTC reclaims $106,300, this rebound could be short-lived.
Momentum remains capped, and the Bollinger Bands are contracting, signaling declining Bitcoin price volatility. This setup increases the likelihood of a breakout or breakdown move in the coming sessions.
Why is the Bitcoin Price Going Down Today?
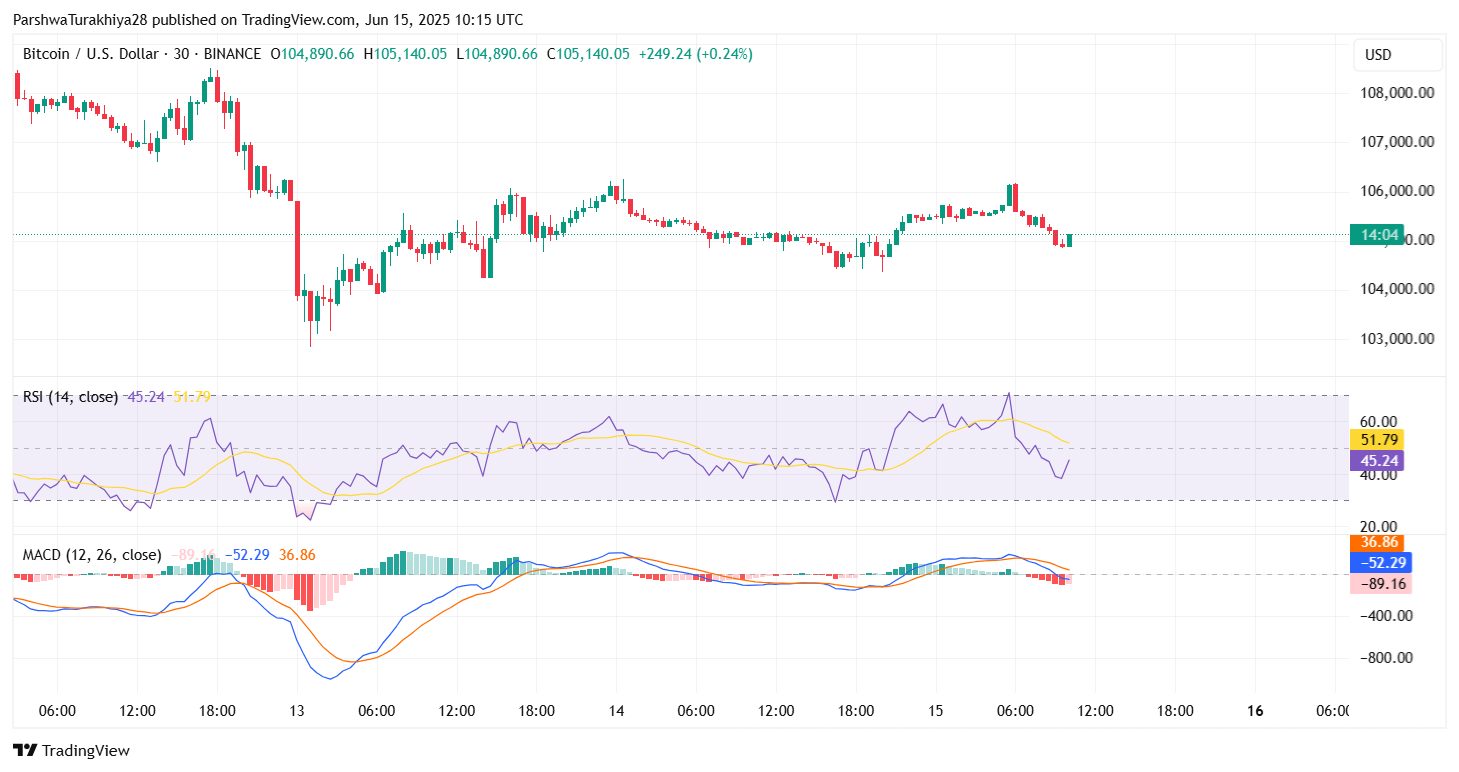
The Bitcoin price is slightly lower today as market participants react to overhead resistance at $105,800 and weak demand at the $106,000 level. The MACD on the 30-minute chart has turned bearish again, while RSI shows a short-term rollover from the 52–53 range back to 45.
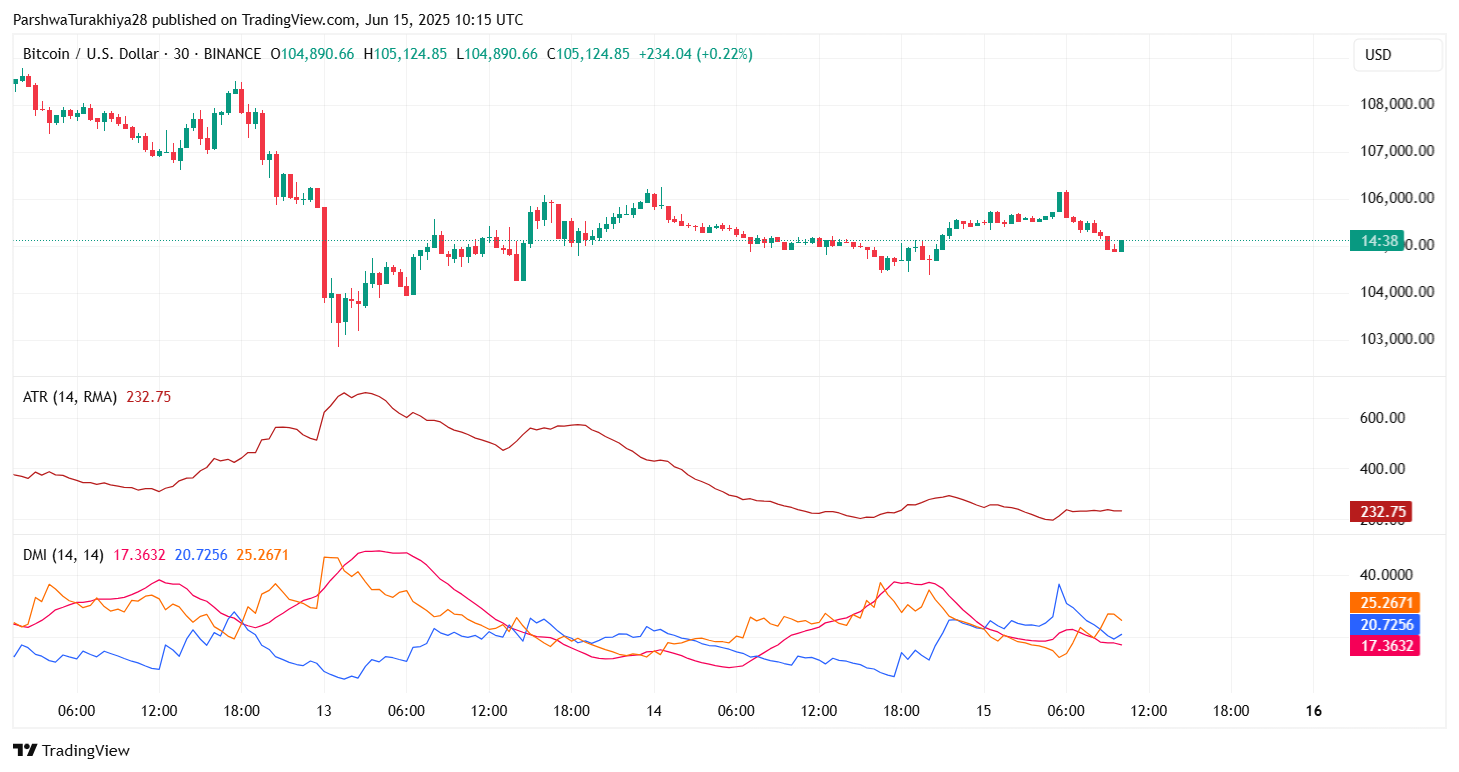
Directional Movement Index (DMI) on the 30-minute chart indicates weak trend strength. The +DI and -DI lines are crossing frequently, and ADX is below 25, suggesting a lack of clear trend direction. With Bitcoin price spikes getting sold off quickly, traders remain cautious heading into the weekend.
If BTC fails to break and close above $106,000 in the next 12–24 hours, the likelihood of a revisit to $103,000–$104,000 strengthens.
Short-Term Outlook: Can BTC Retest $107K or Slide Toward $102K?
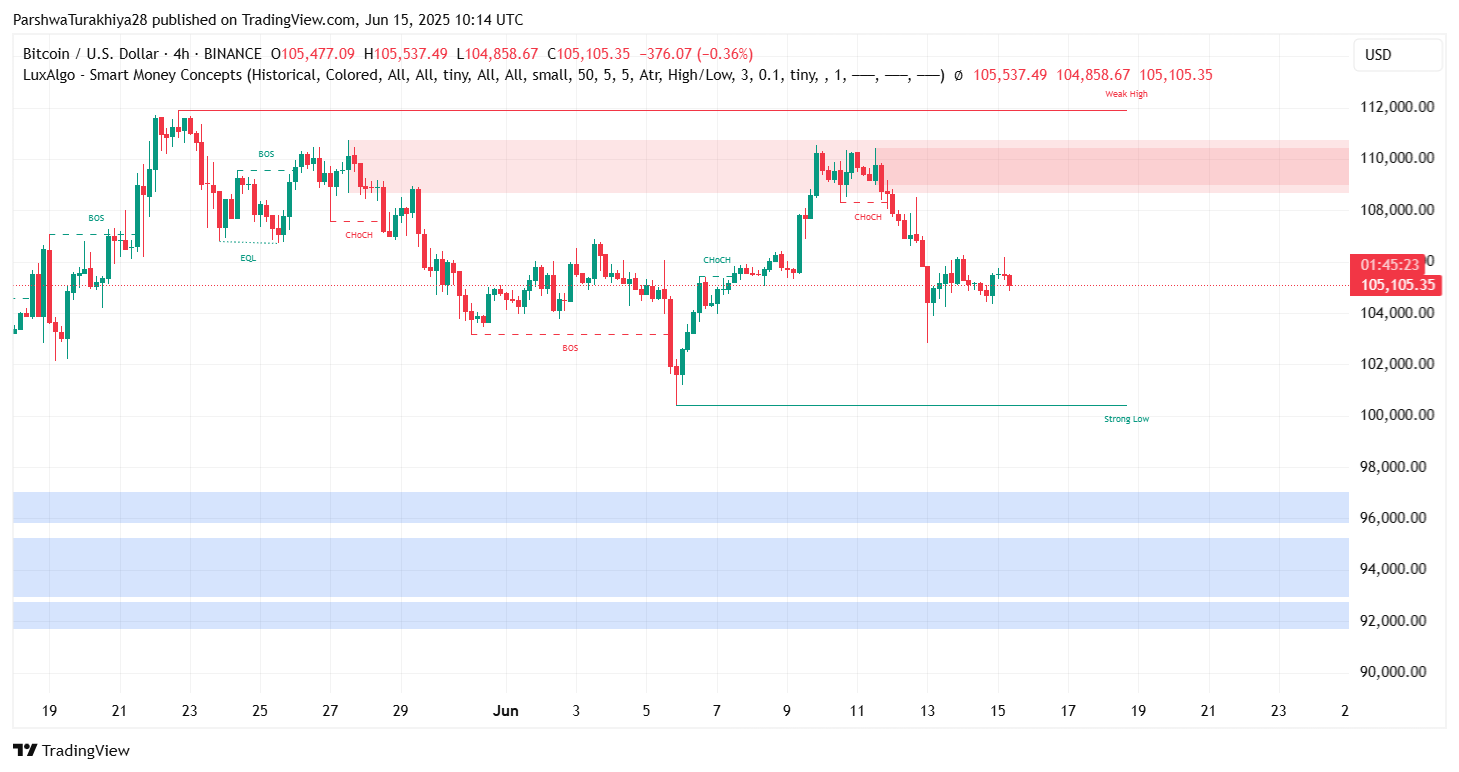
BTC price dynamics (Source: TradingView)
Price structure shows BTC forming a symmetrical triangle, with a potential breakout point near $105,400. If bulls manage to push beyond this level with volume confirmation, the next upside target lies at $107,000, followed by $108,150 (Fib 0.382 on daily).
However, failure to hold $104,200 could trigger a drop to $103,150 and then to $101,200. The latter represents a volume-supported demand zone that may serve as a springboard if tested again.
On the higher timeframe, Bitcoin is still trading above its key bullish breakout line near $100,400 (Fib 1.0 level), which should remain a strong macro support unless sentiment deteriorates sharply.
Bitcoin Forecast Table: June 16 2025
| Indicator | Value / Signal |
| Bitcoin price today | $105,140 |
| Key Resistance | $106,000 / $107,000 / $108,150 |
| Key Support | $104,200 / $103,150 / $101,200 |
| RSI (30-min) | 45.2 (bearish tilt) |
| MACD (30-min) | Bearish crossover |
| Stochastic RSI | Overbought (85–86) |
| DMI | Weak trend, low ADX |
| Bollinger Width | Contracting – breakout likely |
| Fib Levels (Daily) | 0.5: $105,485 / 0.618: $104,291 / 0.786: $102,590 |
Bitcoin remains at a decision point. Bulls must reclaim $106,000–$106,300 with conviction to shift the trend back upward. Until then, the broader bias remains neutral with downside risk toward $103,000 if momentum stalls.
Disclaimer: The information presented in this article is for informational and educational purposes only. The article does not constitute financial advice or advice of any kind. Coin Edition is not responsible for any losses incurred as a result of the utilization of content, products, or services mentioned. Readers are advised to exercise caution before taking any action related to the company.