Bitcoin’s volatility has dropped to its lowest level in nearly a decade, a sign of a major structural shift in the market’s behavior. According to new data visualized by Ecoinometrics, Bitcoin’s 30-day realized volatility sits near the 10th percentile, meaning current market fluctuations are calmer than 90% of all weekly periods since 2015, suggesting Bitcoin is maturing into a more stable asset even as it continues its strong upward trend.
This dramatic decline in volatility, which comes despite a sharp rally in May and the asset reaching new all-time highs, marks a significant change in Bitcoin’s risk profile and could make it far more attractive to a new class of institutional investors.
A New Era of Stability: Bitcoin’s Risk Profile Is Changing
The heatmap, based on percentile rankings of Bitcoin’s weekly volatility over a 30-day rolling window, illustrates this clear trend toward calmer market conditions.
In past years, particularly between 2016 and 2021, the chart showed deep red zones, indicating numerous highly volatile weeks. In contrast, the chart for late 2024 and 2025 is dominated by blue and green zones, representing sustained periods of lower volatility.
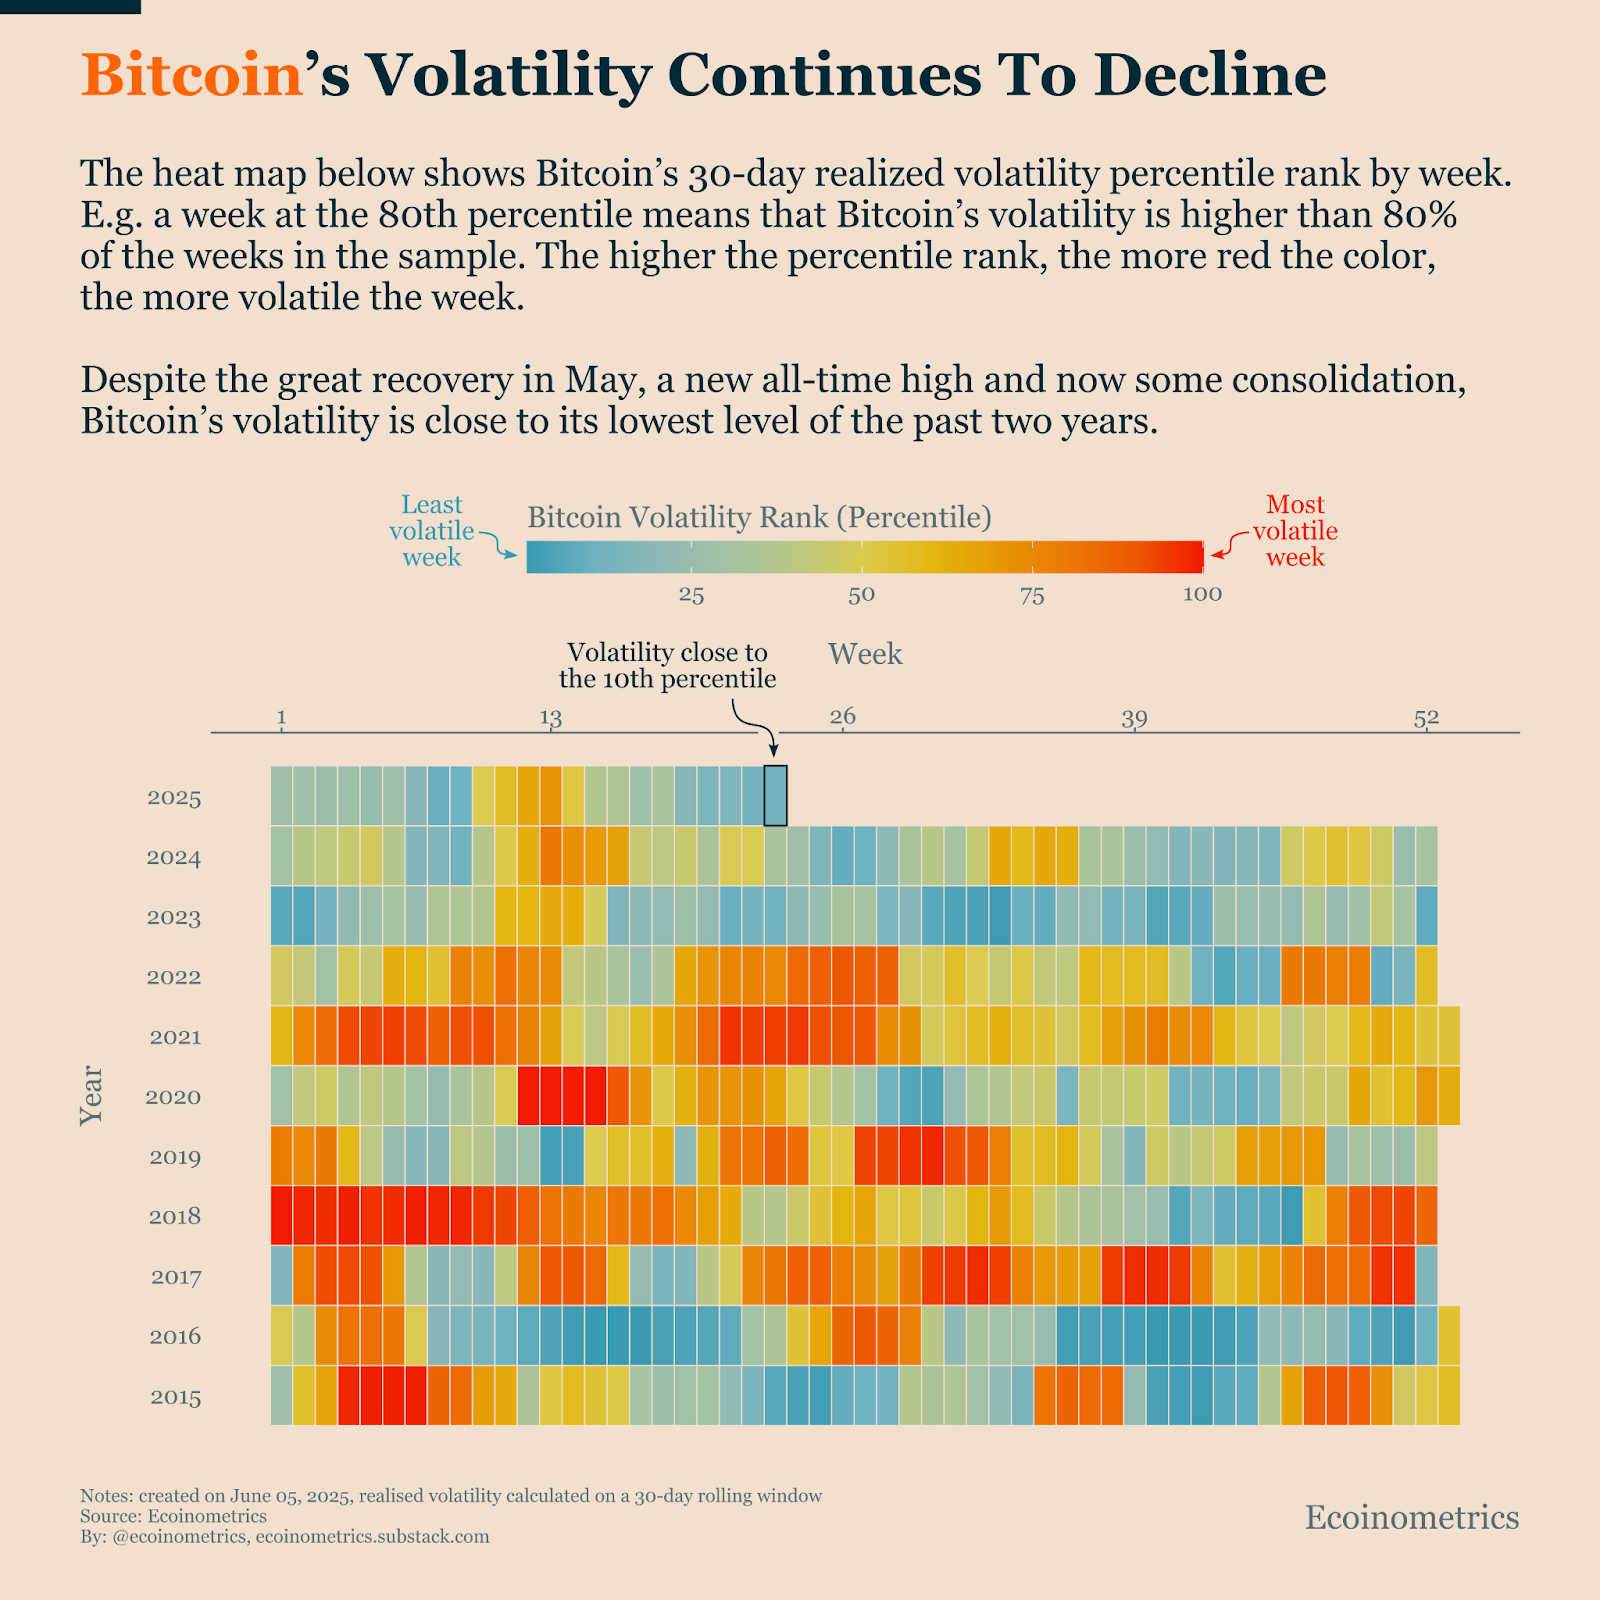
This shift suggests Bitcoin is starting to behave more like a maturing financial asset, one capable of delivering strong returns without the intense, short-term price swings that previously defined it.
Related : Bitcoin Asia Rolls Out Free General Admission to Broaden Access to 2025 Conference
For portfolio managers focused on managing risk, this trend is critical. Bitcoin’s newfound stability allows for its inclusion in diversified portfolios without breaching traditional risk thresholds, potentially unlocking broader capital from institutional finance.
Price Action Confirms Bullish Trend Within Ascending Channel
This backdrop of decreasing volatility is occurring while Bitcoin’s price carves out a powerful, bullish pattern on the weekly chart. As of June 9, 2025, Bitcoin (BTC) is trading at $107,841 and has formed a clear ascending channel on the weekly chart. This pattern is marked by two upward-sloping parallel trendlines, capturing higher highs and higher lows since late 2022.
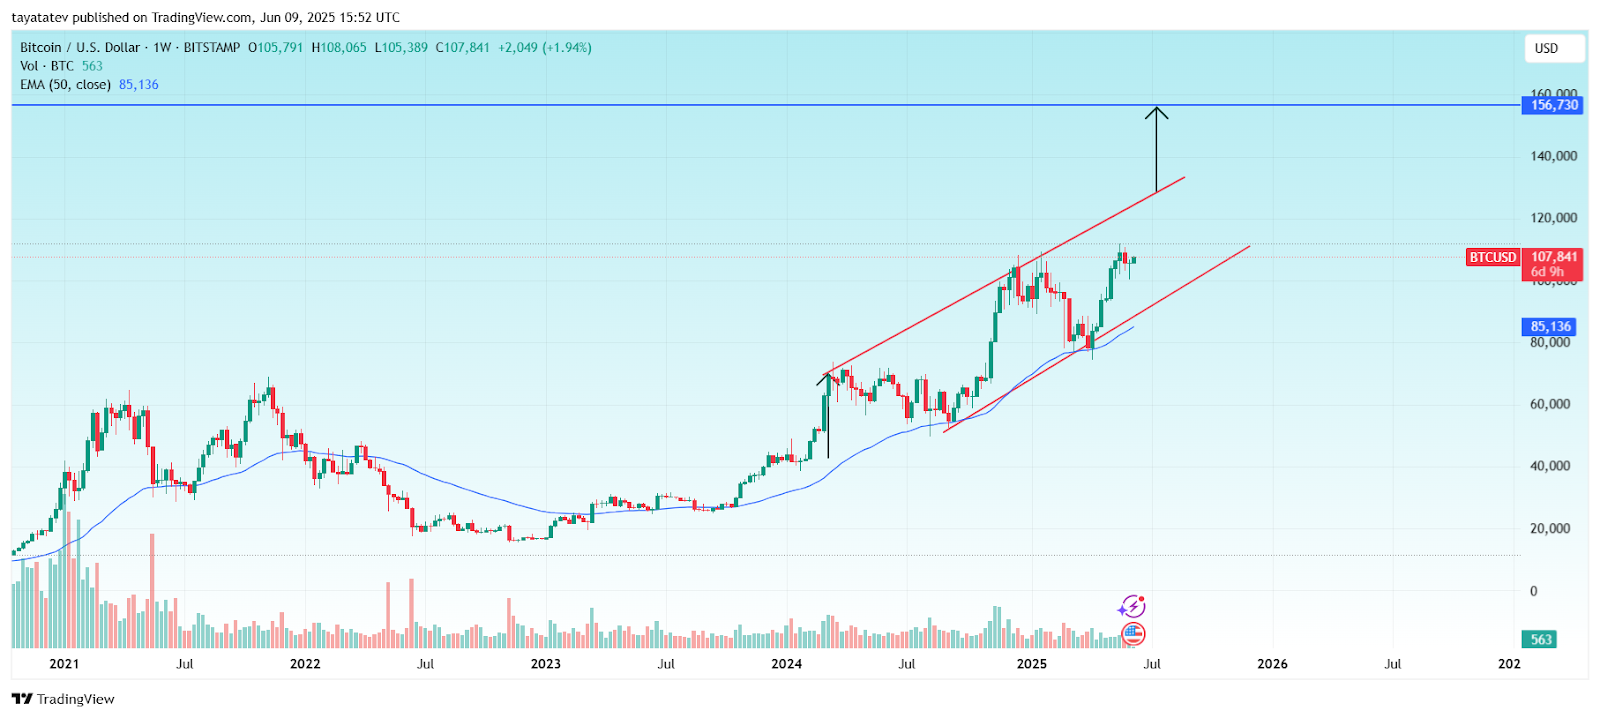
An ascending channel is a bullish continuation pattern that shows consistent upward momentum within a defined range. The 50-week Exponential Moving Average (EMA), currently at $85,136, has been acting as solid dynamic support, with every significant dip since mid-2023 finding a floor at this key indicator.
Related: Bitcoin (BTC) Price Prediction for June 10: Volatility Builds Near $106K as Bulls Eye Breakout Levels
If this structure confirms with a breakout toward the upper boundary, Bitcoin’s price could climb approximately 46% from the current level. This would bring the target near $156,730, as indicated by the top of the projected channel.
Disclaimer: The information presented in this article is for informational and educational purposes only. The article does not constitute financial advice or advice of any kind. Coin Edition is not responsible for any losses incurred as a result of the utilization of content, products, or services mentioned. Readers are advised to exercise caution before taking any action related to the company.