Bitcoin’s price hovered near $107,392 on June 9, 2025, supported by a market capitalization of $2.12 trillion and a 24-hour trade volume of $19.68 billion. Trading within an intraday range of $105,112 to $107,499, bitcoin showed strong short-term bullish momentum across multiple technical indicators and timeframes.
Bitcoin
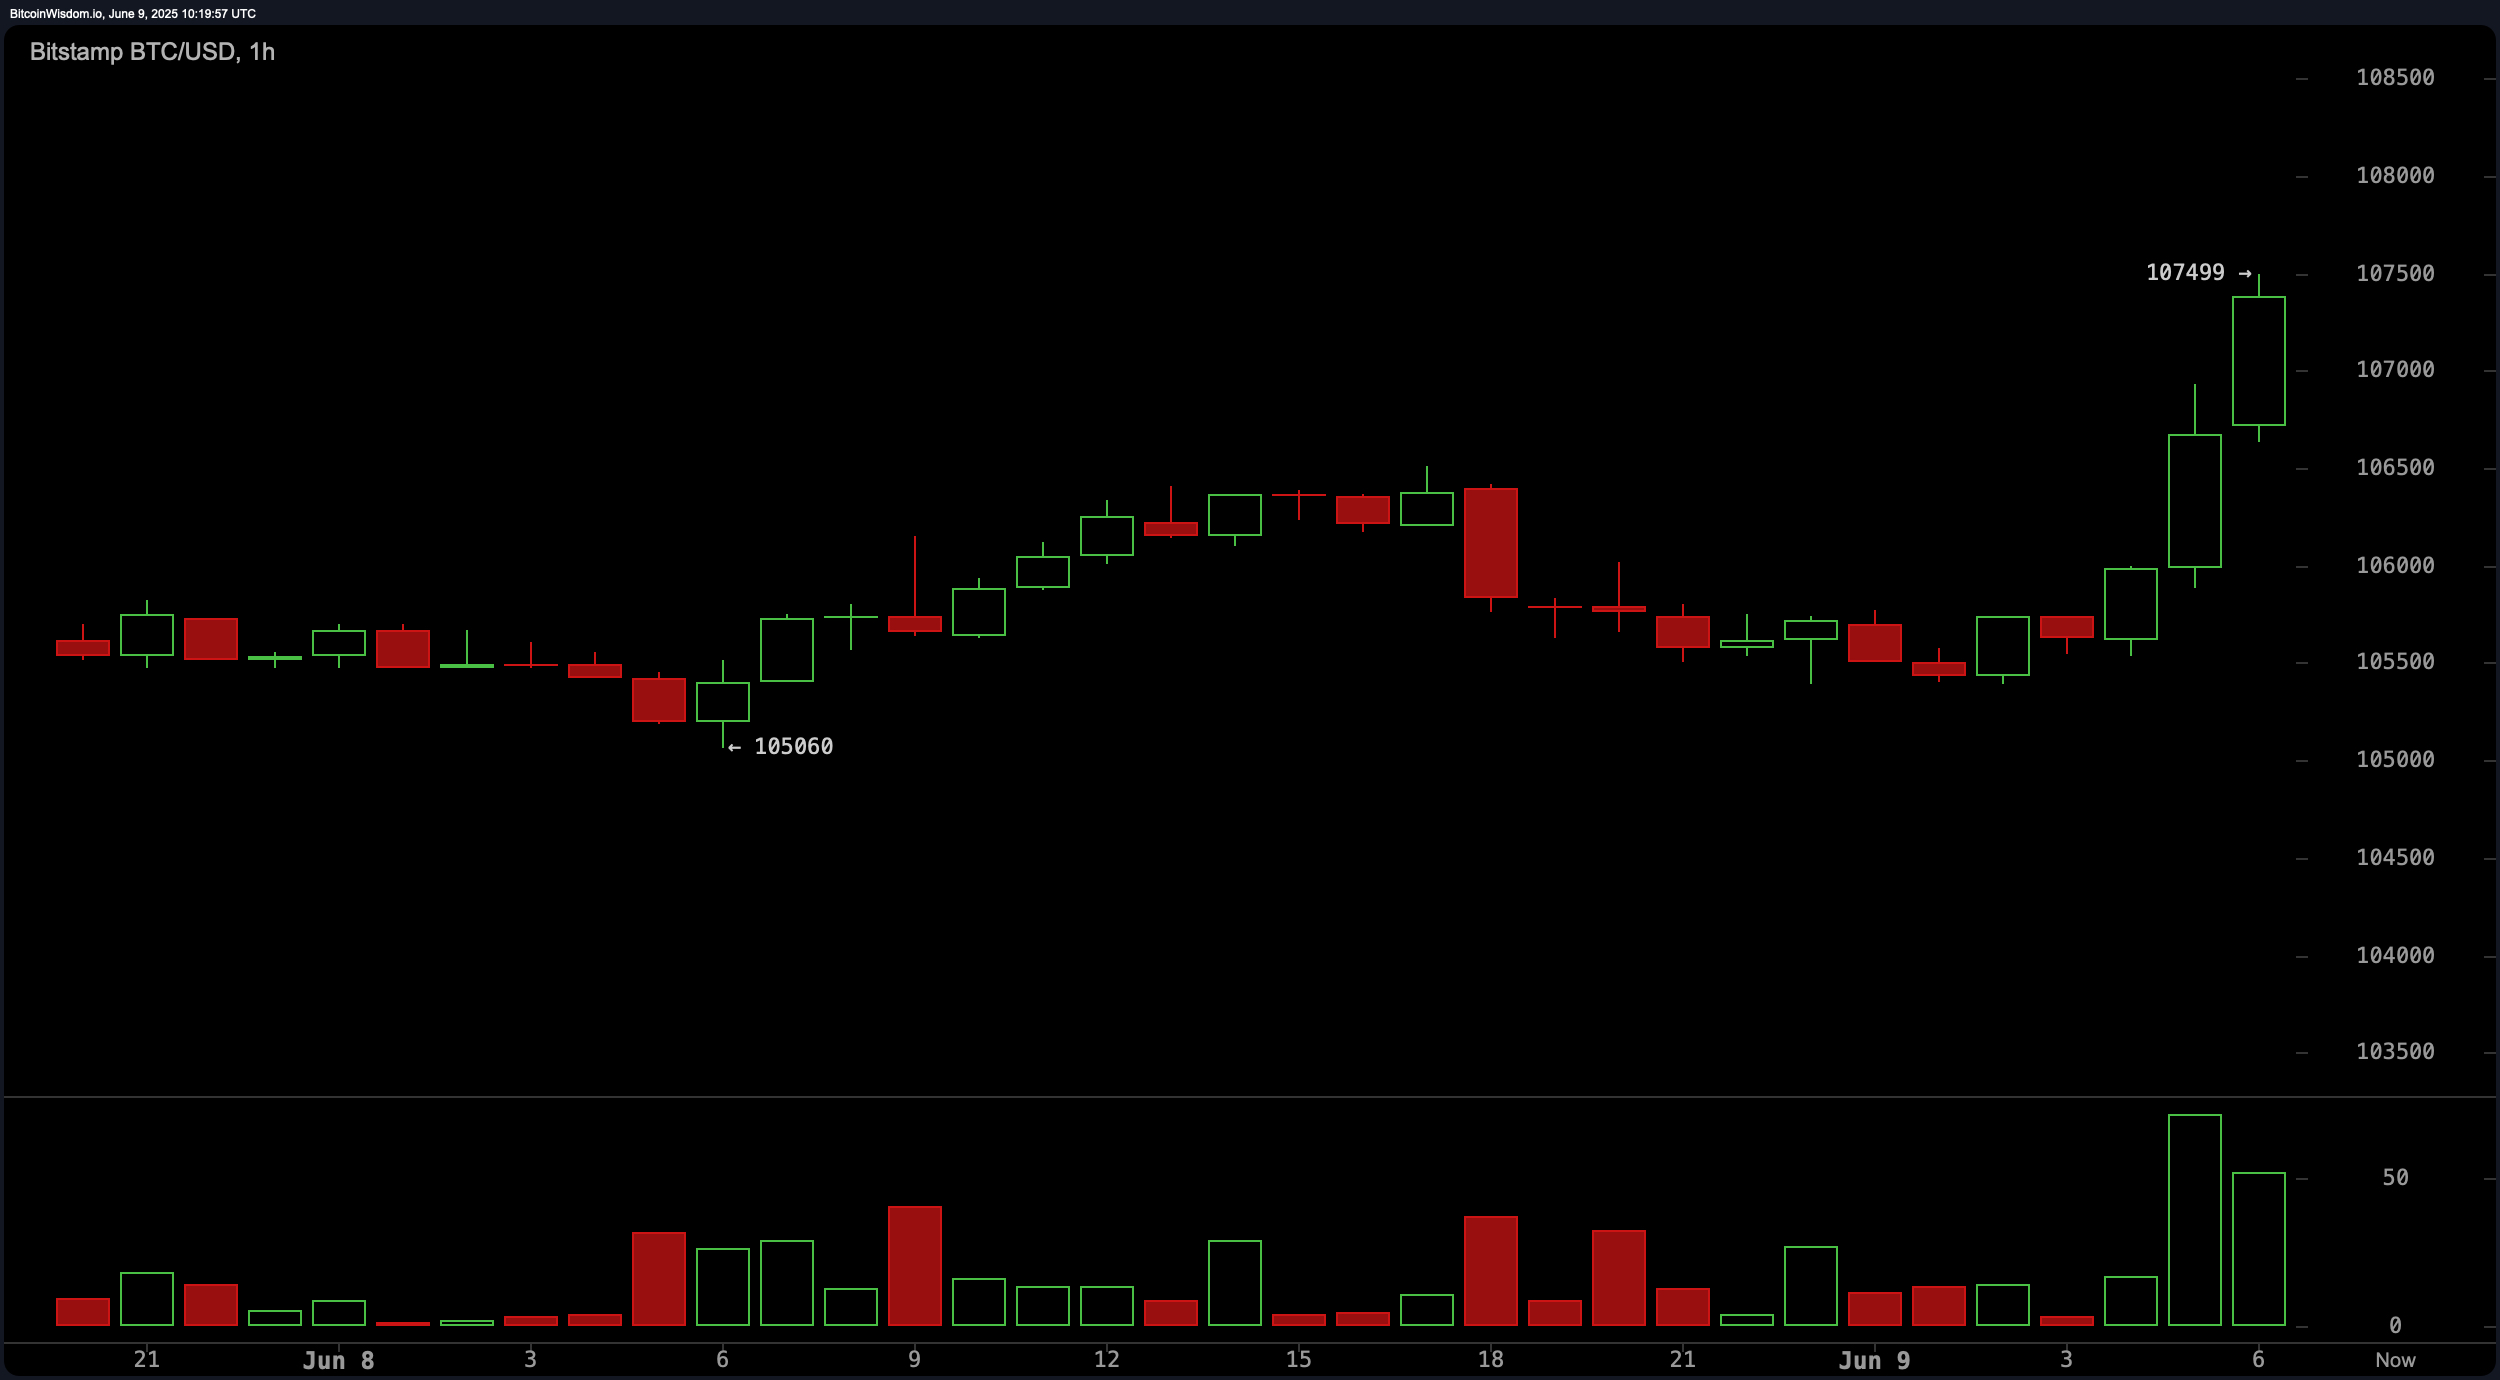
The 1-hour chart presents a scenario of a breakout from consolidation, marked by a sudden surge in bullish momentum. After days of tight sideways movement between June 6 and 8, bitcoin pushed sharply upwards on June 9, touching a high of $107,499. The prevailing momentum suggests further upward potential, with the next psychological resistance sitting at $108,000 and then $110,000.
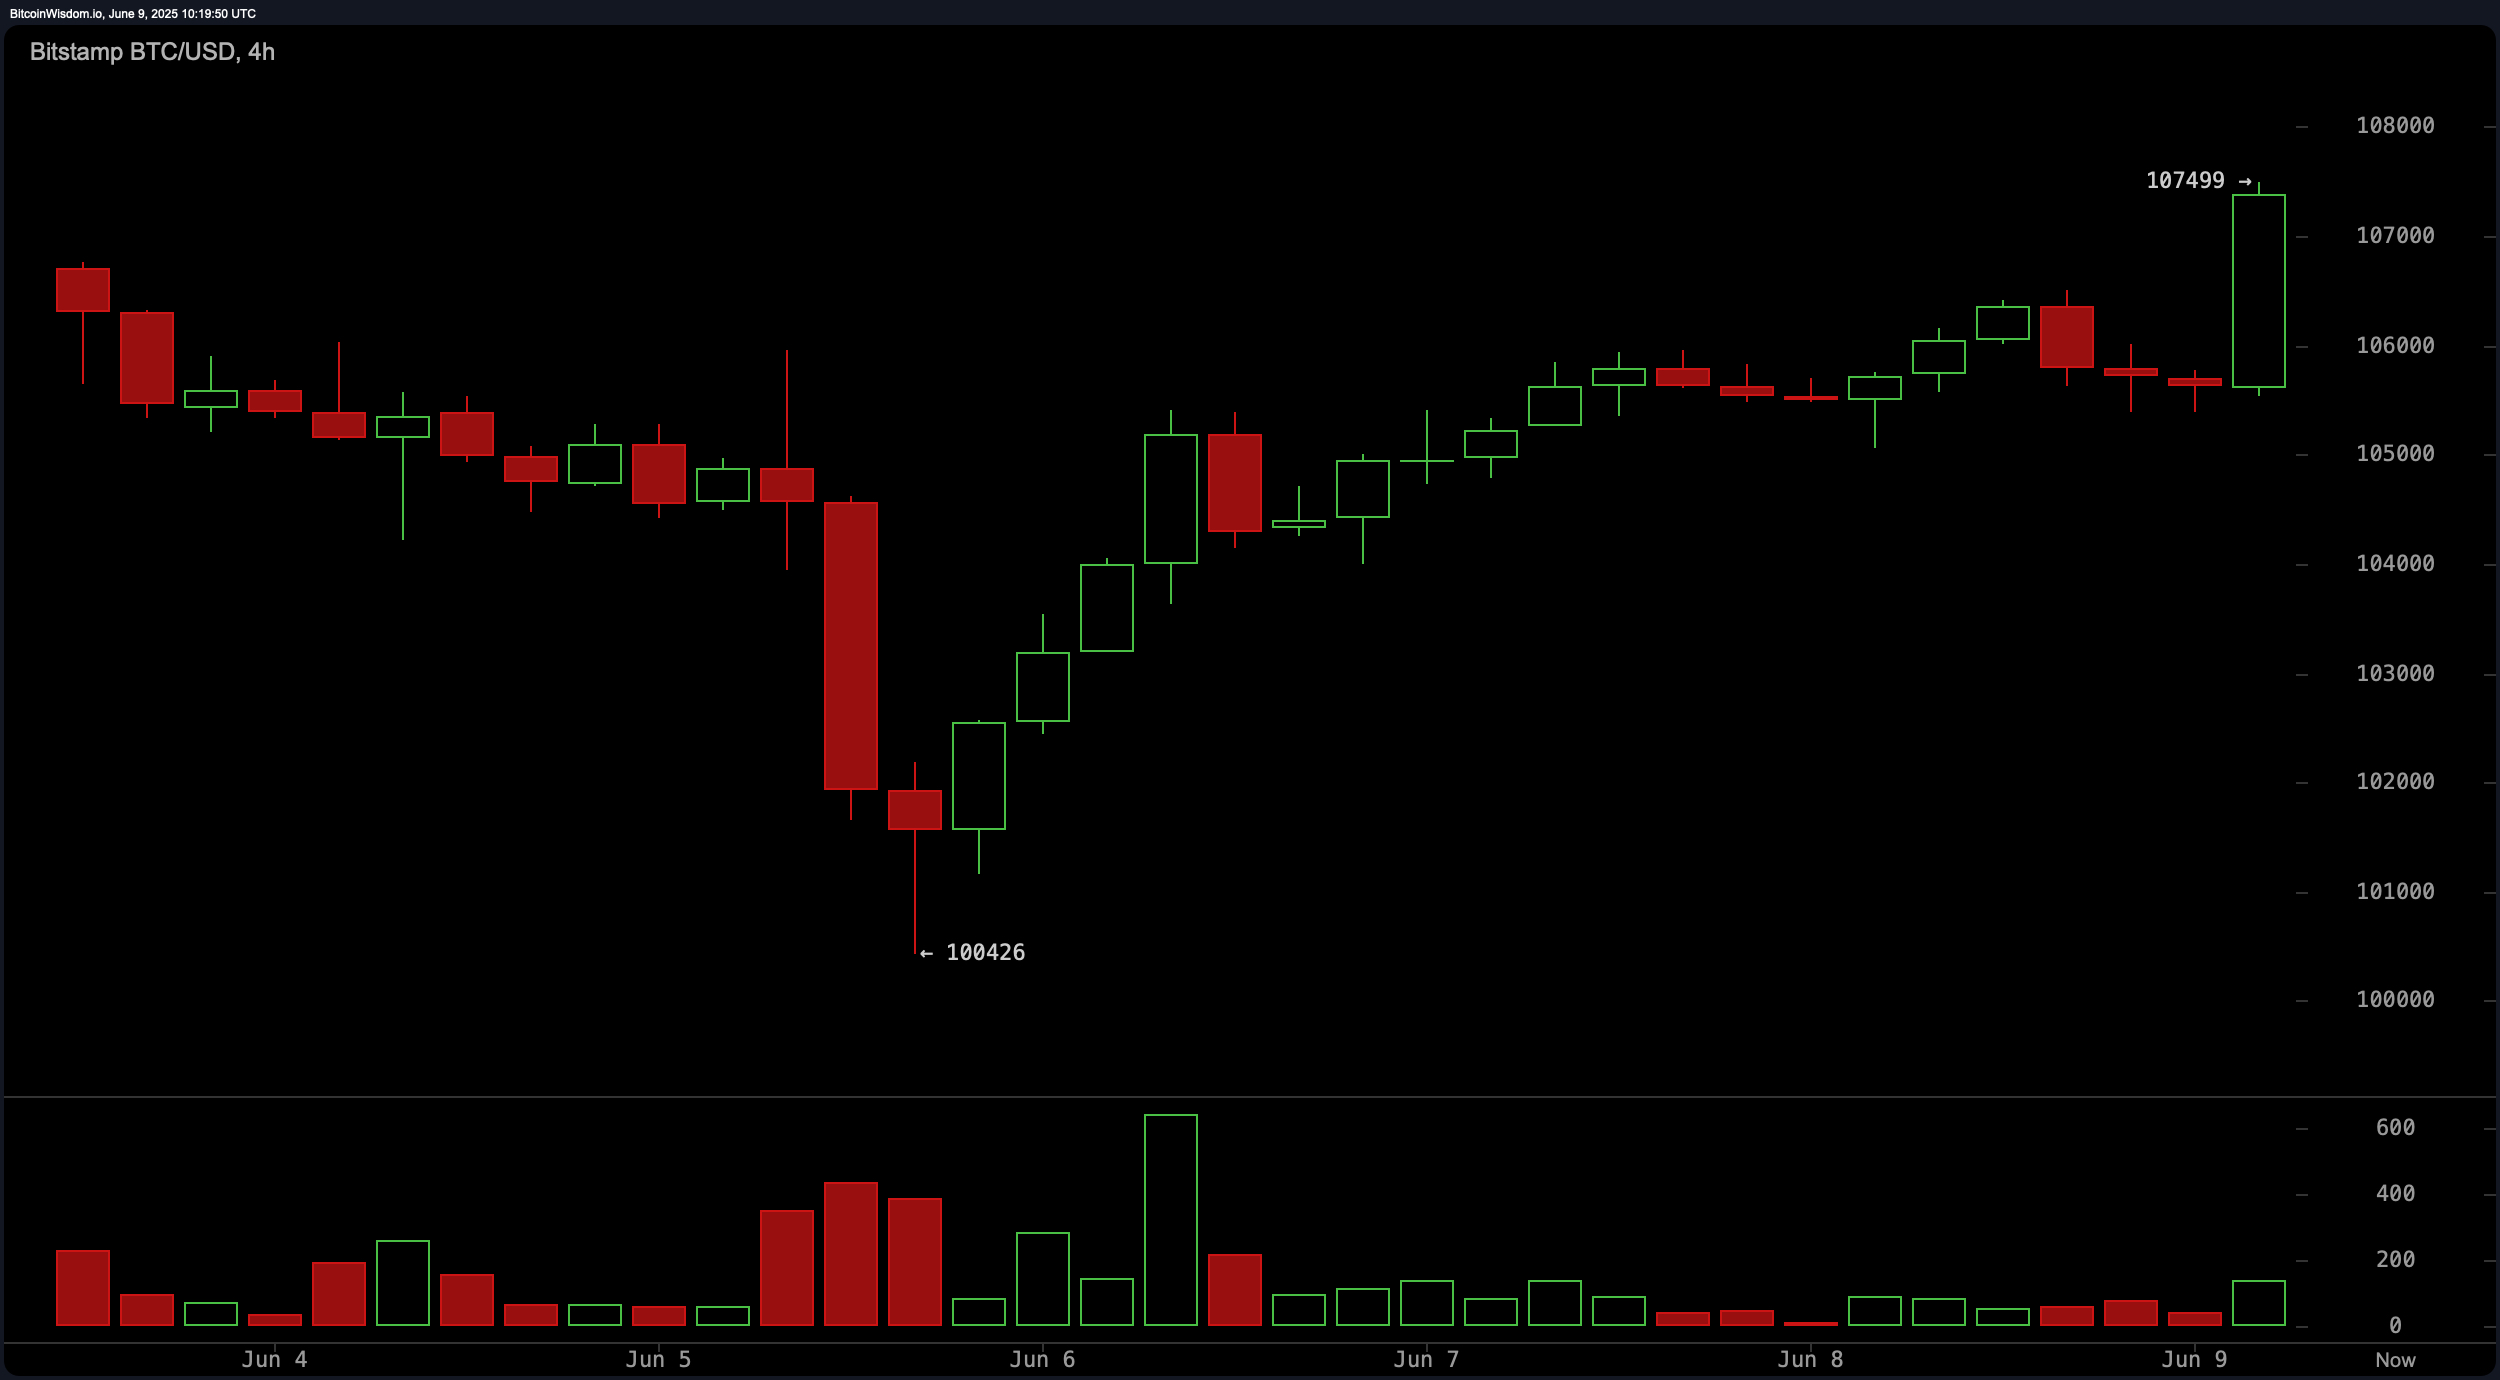
The 4-hour chart signals a classic V-shaped recovery, bolstered by strong bullish volume as bitcoin rebounded sharply from a support level at $100,426. This move breached prior resistance levels, with momentum favoring further upside if price action can hold above $107,500. The breakout candle reflects strength and buyer confidence, but traders should eye the $109,500 to $110,000 range for potential exits.
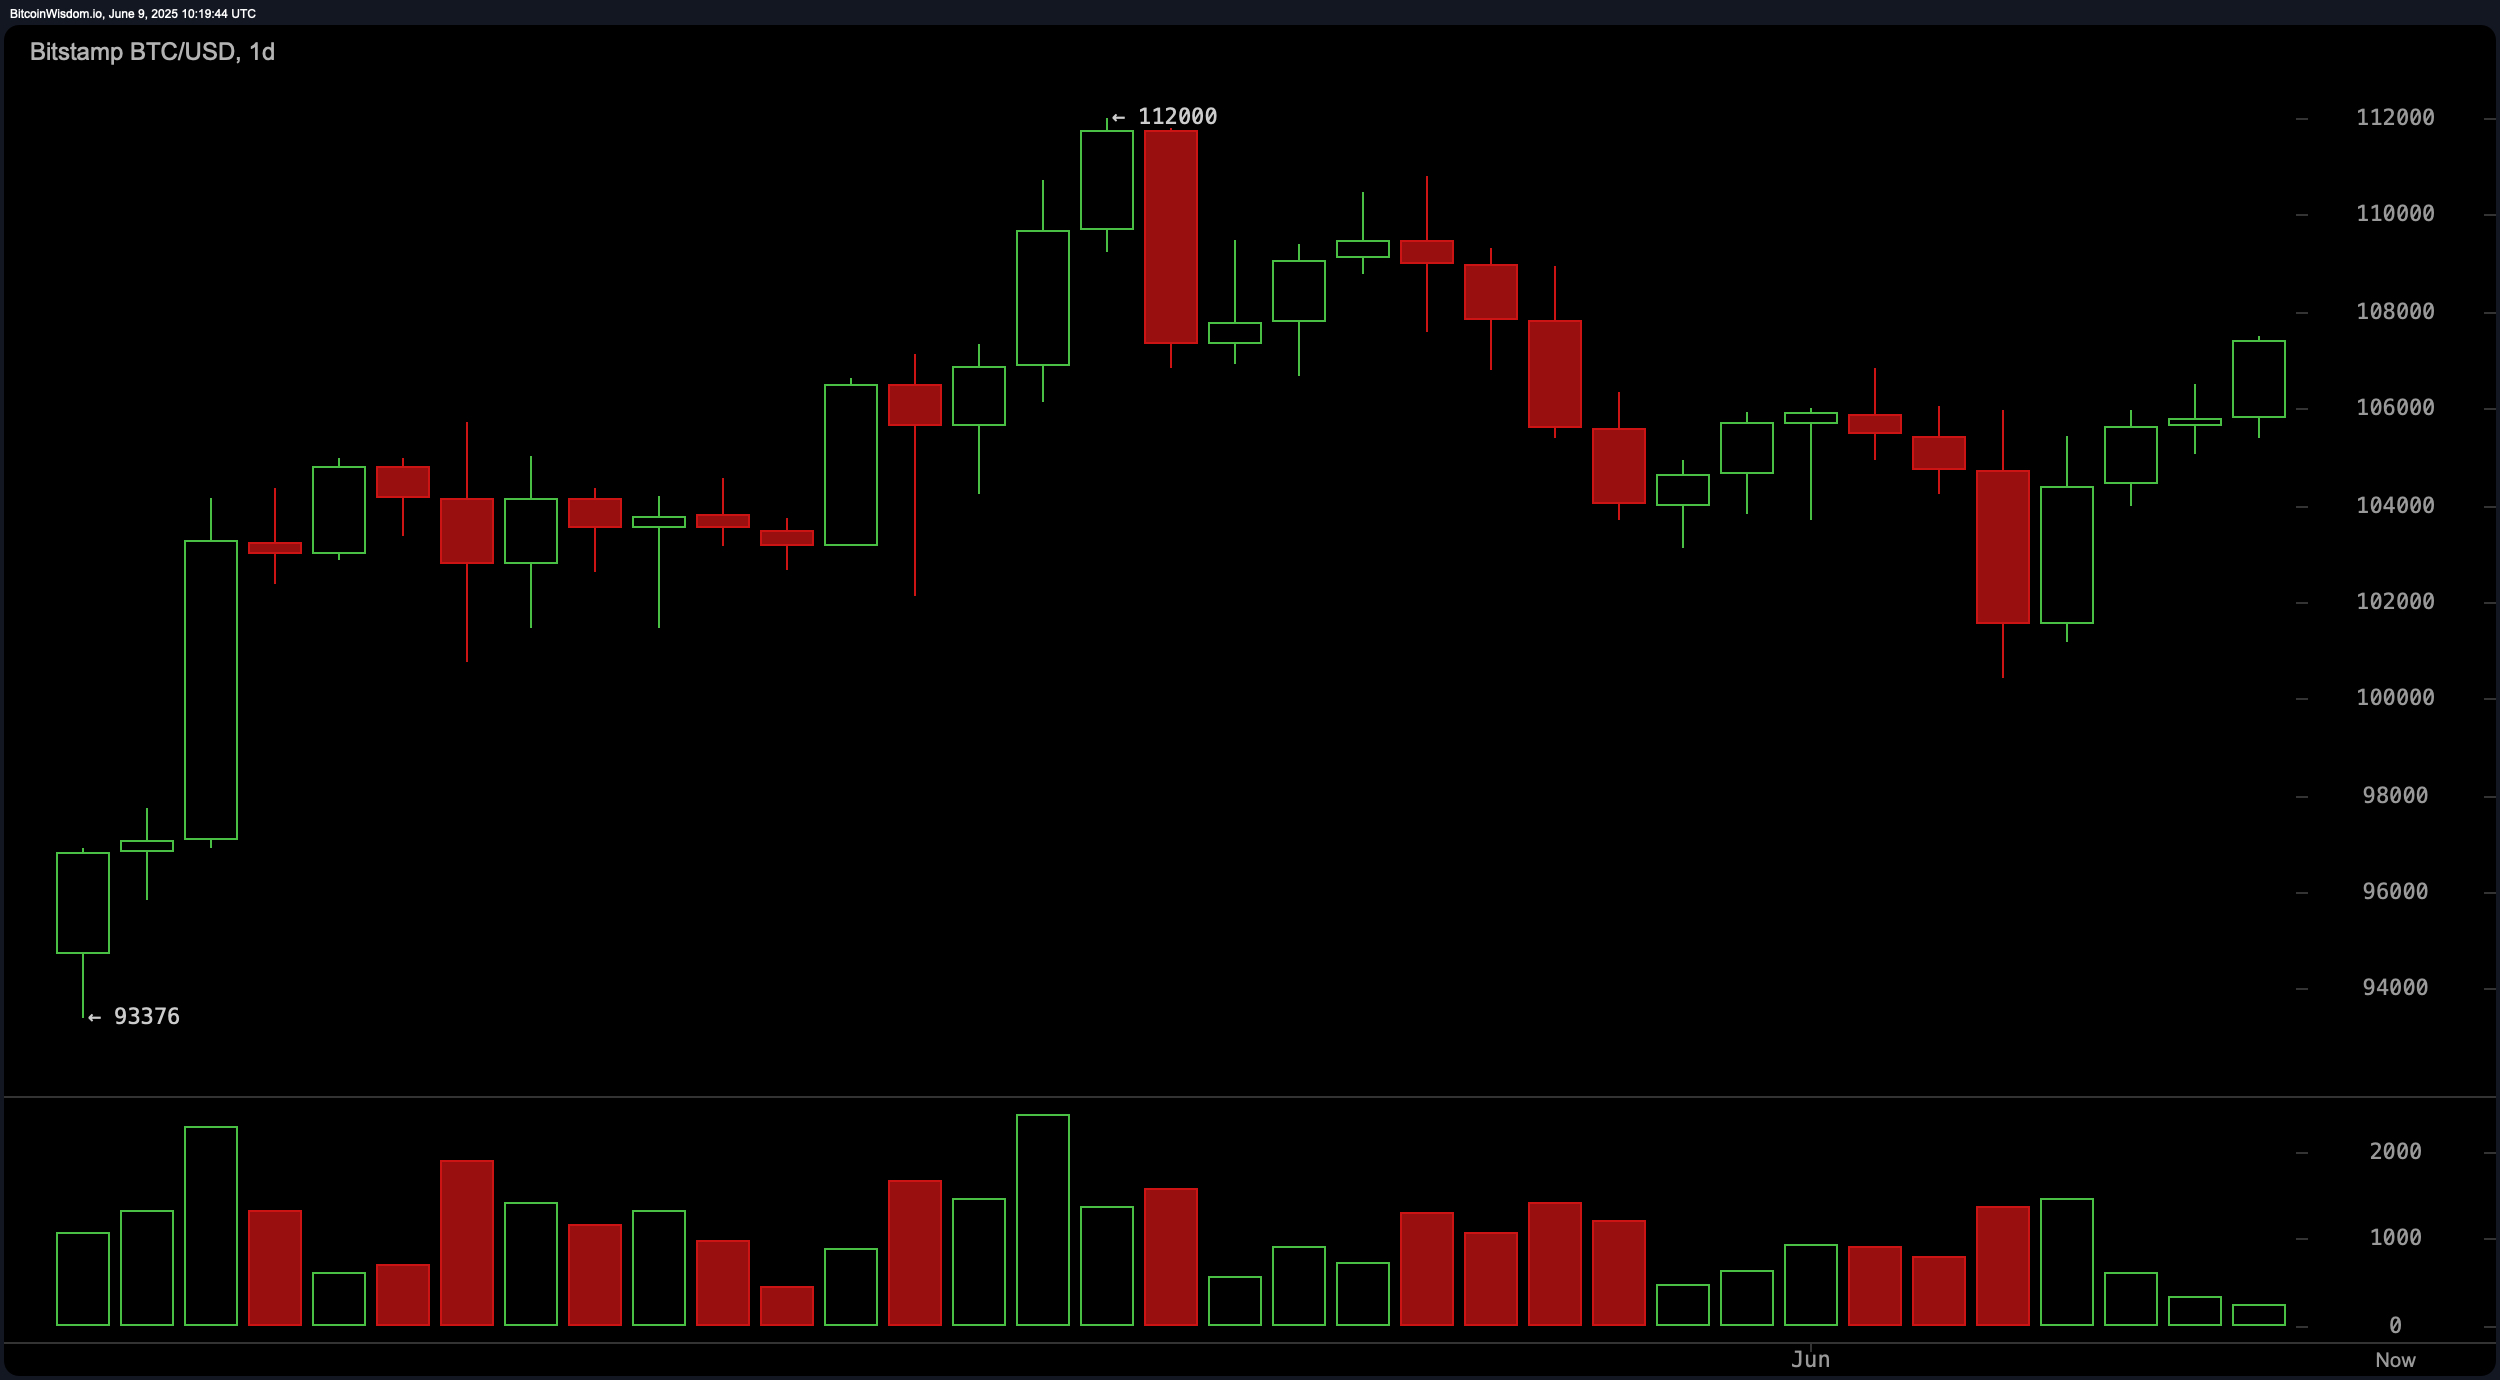
From a broader perspective, the daily chart suggests a recovery phase following a drop from the $112,000 level. Bitcoin found solid support near $100,000 and is showing bullish candlestick formations, albeit with reduced but gradually increasing volume. The price is approaching local resistance near $108,000, and a daily close above this level could pave the way for a retest of $112,000.
Oscillators reflect a largely neutral sentiment, with the relative strength index (RSI) at 58 and the Stochastic at 56. The commodity channel index (CCI) and average directional index (ADX) also reflect neutrality. However, momentum shows a buy signal with a value of 3,335, suggesting bullish pressure. The moving average convergence divergence (MACD) level of 879 remains bearish, indicating some lingering caution among traders.
Moving averages reinforce the bullish undertone, with all major exponential and simple moving averages from 10 to 200 periods flashing bullish signals. The 10-period exponential moving average (EMA) and simple moving average (SMA) are at $105,591 and $105,118 respectively, well below the current price. Longer-term EMAs and SMAs continue to show strength, with the 200-period EMA and SMA resting at $91,916 and $95,352. This strong alignment of price above all key moving averages supports continued upward movement barring a sudden shift in sentiment.
Bull Verdict:
Bitcoin’s current trajectory, supported by strong moving average signals and recent breakout momentum across the 1-hour and 4-hour charts, points to continued upside potential. If the price closes above $108,000, a retest of the $112,000 resistance appears likely, positioning bitcoin for a potential new leg higher.
Bear Verdict:
Despite short-term bullish signals, lingering concerns from the recent high-volume sell-off and a bearish moving average convergence divergence (MACD) reading suggest caution. Failure to sustain levels above $107,500 or rejection at $108,000 could trigger a reversal toward the $104,000 to $100,000 support zone.