The price of bitcoin hovered at $105,384 on June 8, 2025, with a market capitalization of $2.09 trillion and a 24-hour trading volume of $15.81 billion. Throughout the session, it moved within a tight intraday range of $105,112 to $105,891, indicating relative short-term stability amid a broader consolidation.
Bitcoin
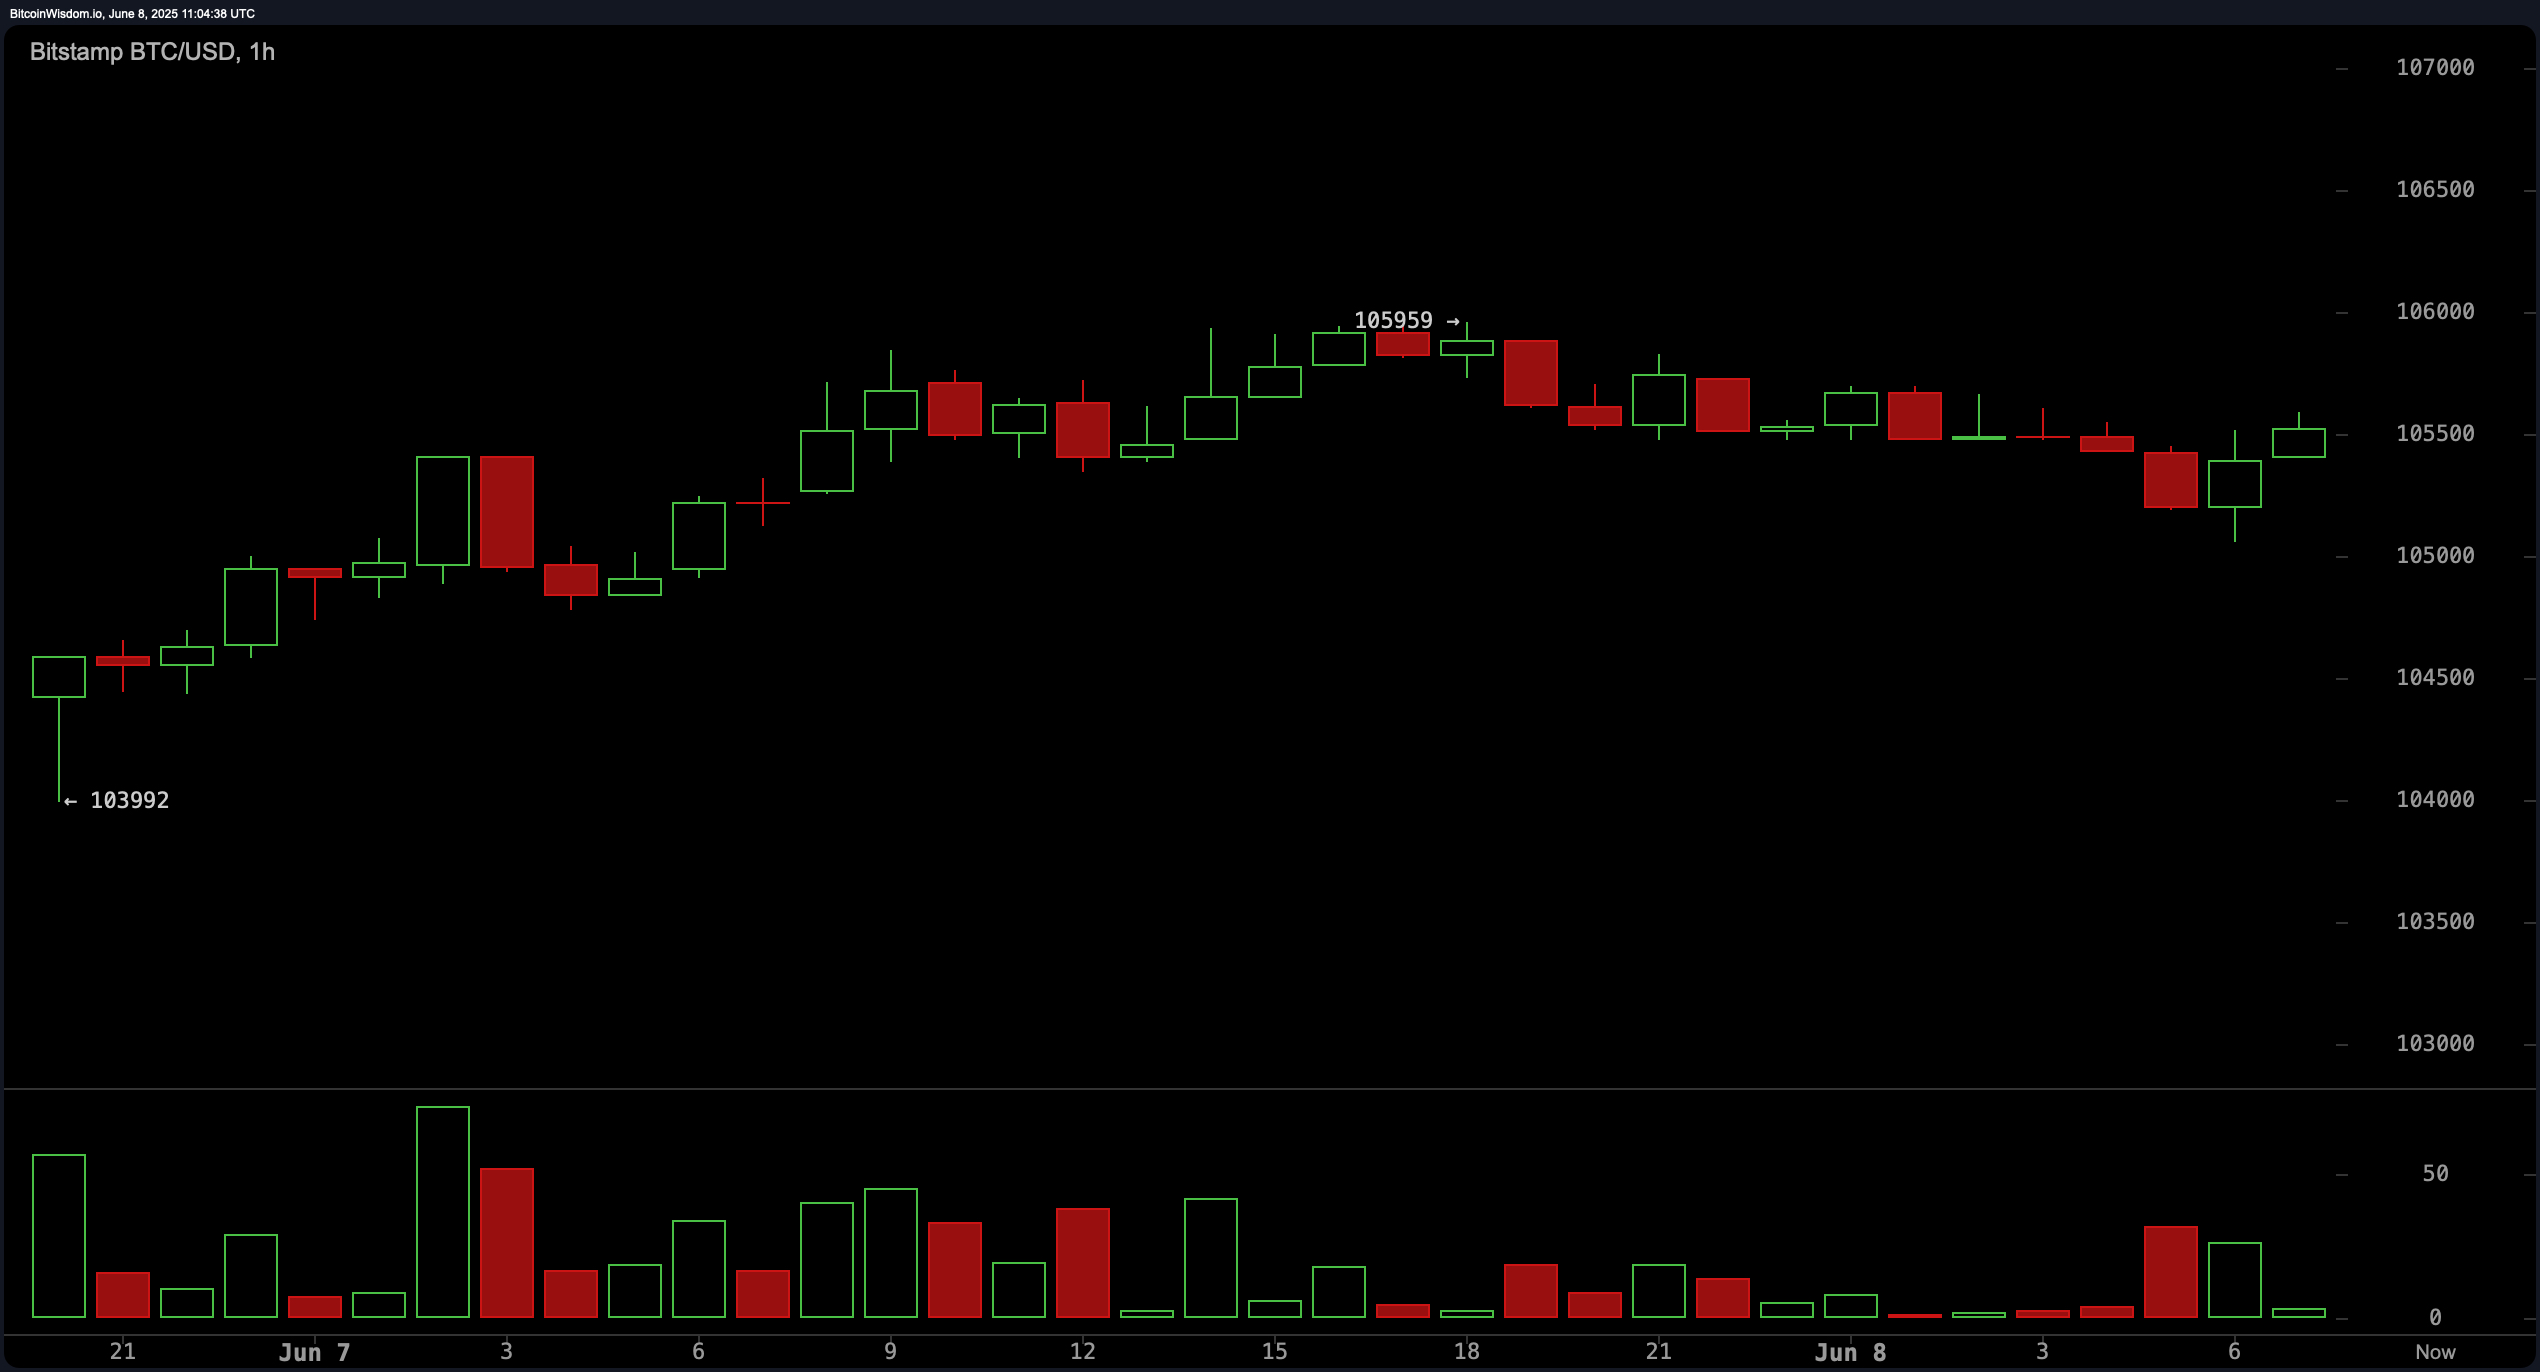
The 1-hour chart analysis reveals a consolidation phase for bitcoin between $105,000 and $106,000, suggesting indecision in the immediate market direction. The last peak at $106,000 created a rounded top pattern, hinting at weakening bullish momentum. With support forming at $104,500, a breakout above $106,000 backed by strong bullish volume could ignite a fresh upward leg. Conversely, a price dip to the $104,800 level accompanied by decreasing sell volume might serve as a scalp buy opportunity. An appropriate exit for short-term positions lies near $106,500–$107,000, with stop-loss placements advised below $104,500 to mitigate downside risk.
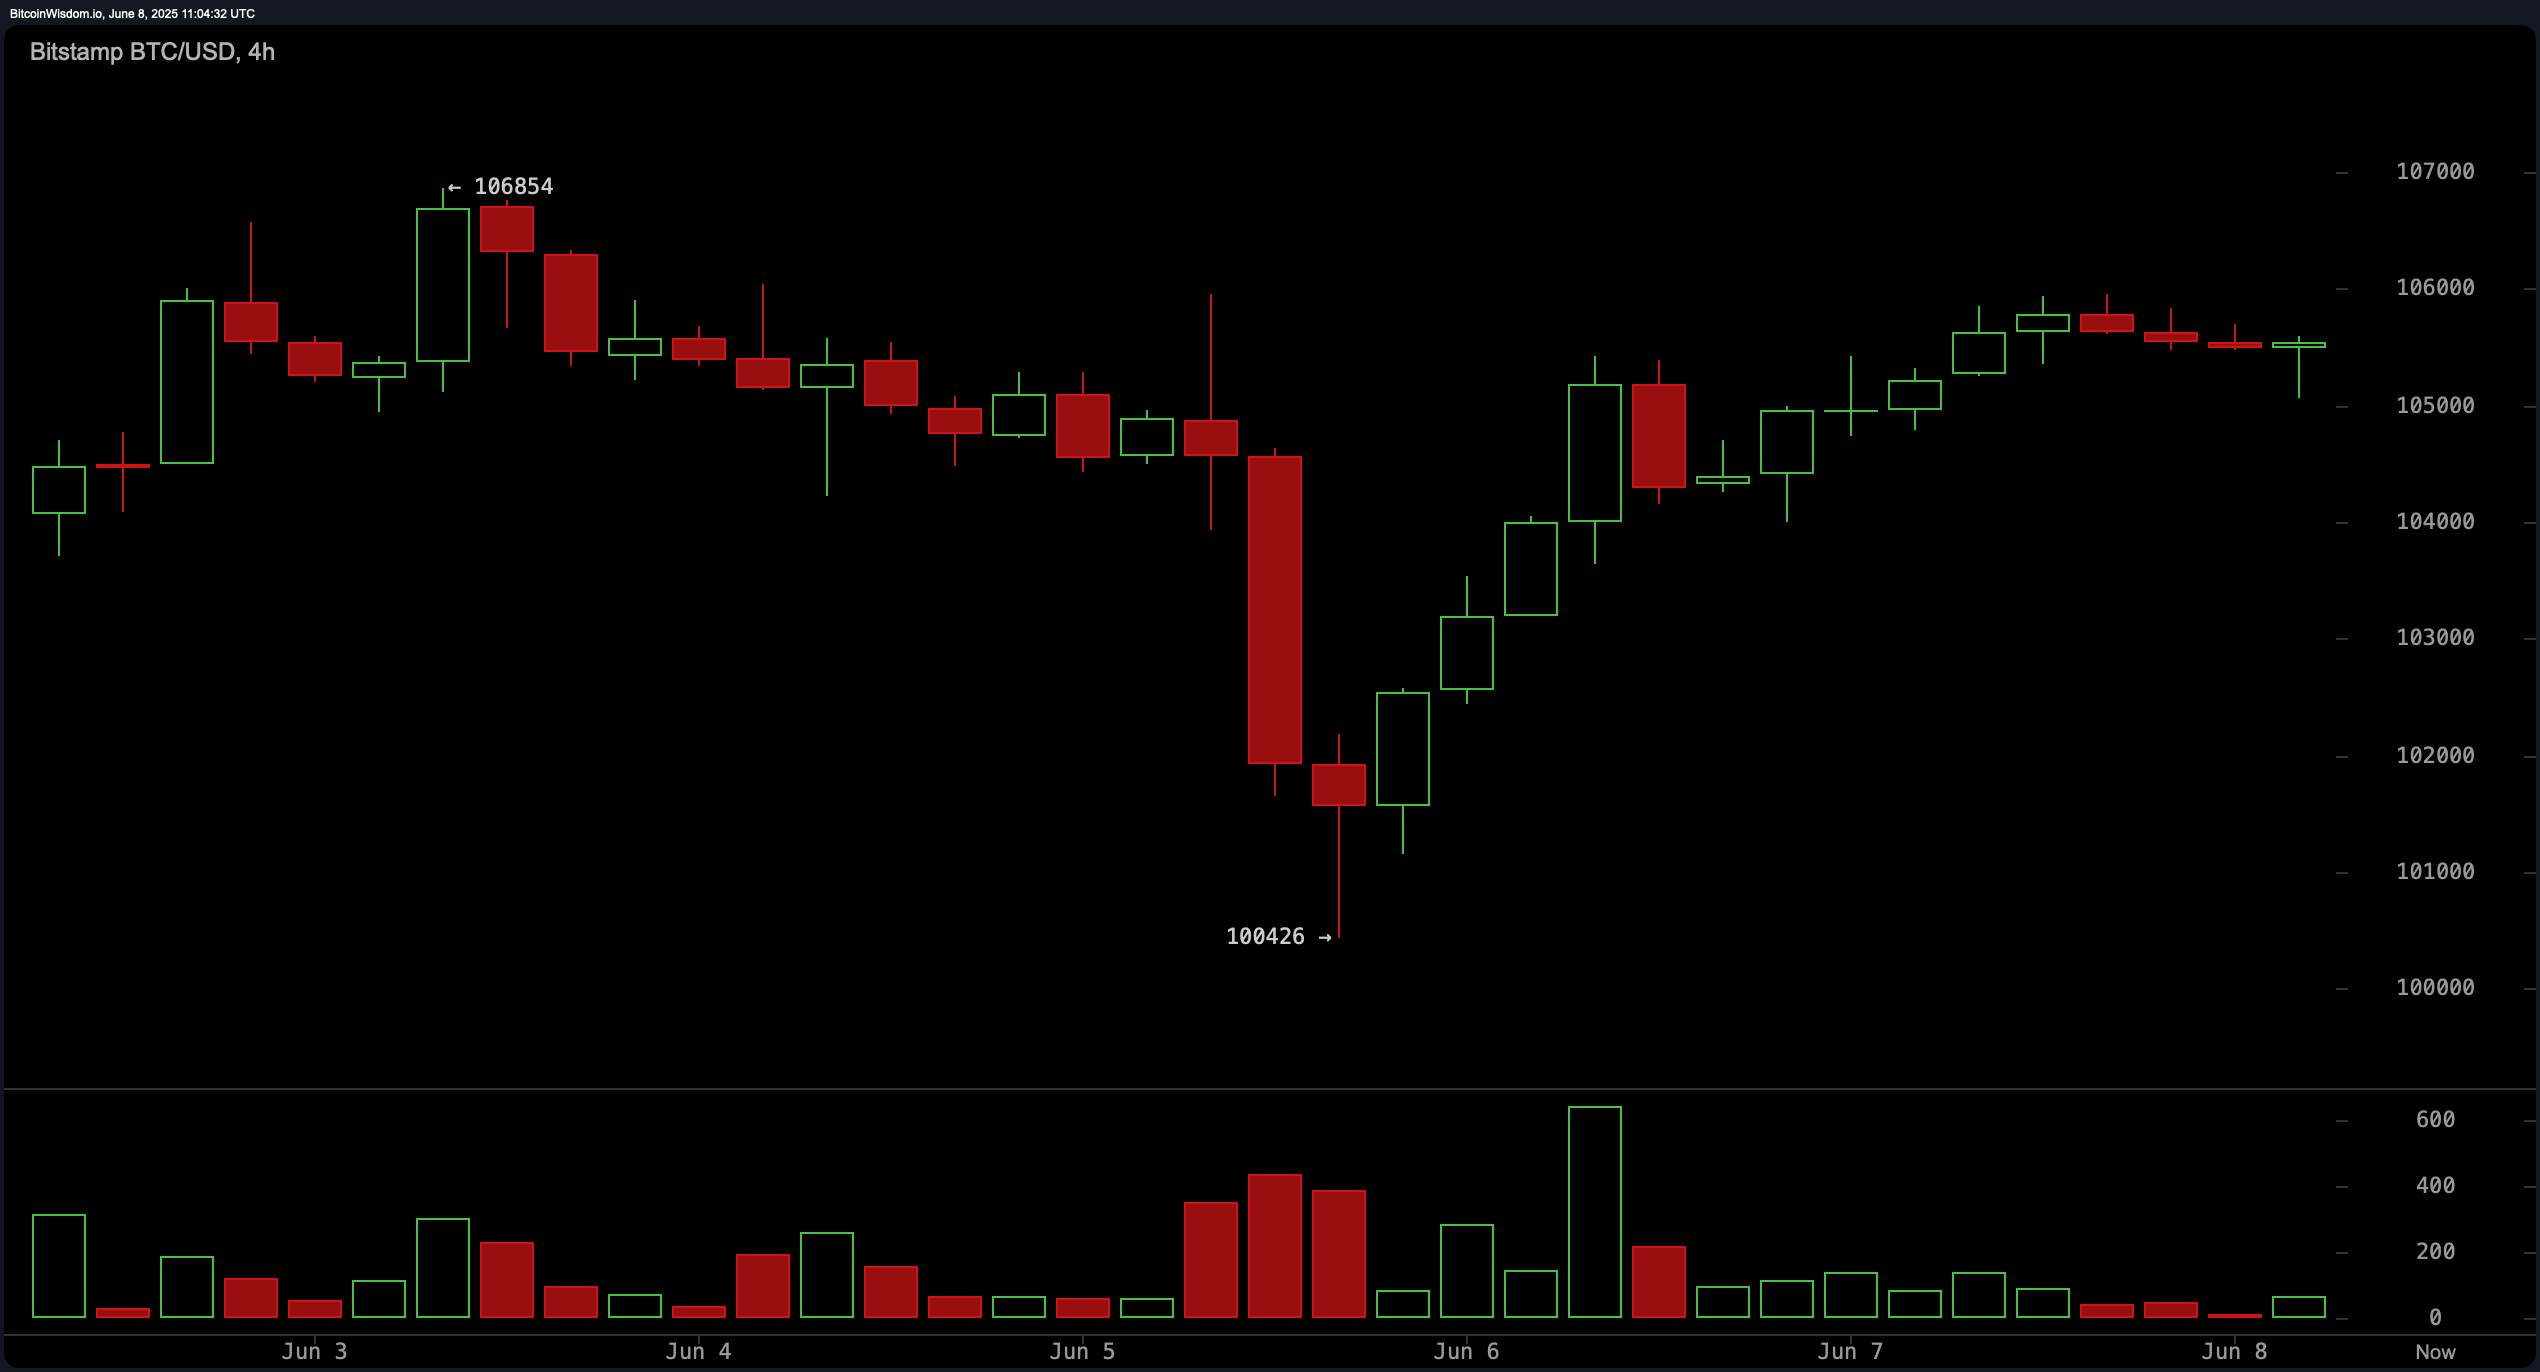
On the 4-hour chart, bitcoin illustrated a V-shaped recovery after dipping to $100,426, with a series of higher highs and higher lows manifesting since June 6. Despite this bullish structure, resistance at $106,800 has formed, and recent candlestick patterns signal market hesitation near that level. A confirmed breakout above this resistance could validate a long entry, whereas rejection may lead to a pullback toward the $102,500–$103,000 zone. Traders eyeing this time frame should consider entries around $104,500–$105,000 and stagger exits between $107,000–$108,000, maintaining vigilance for false breakouts amid declining volume.
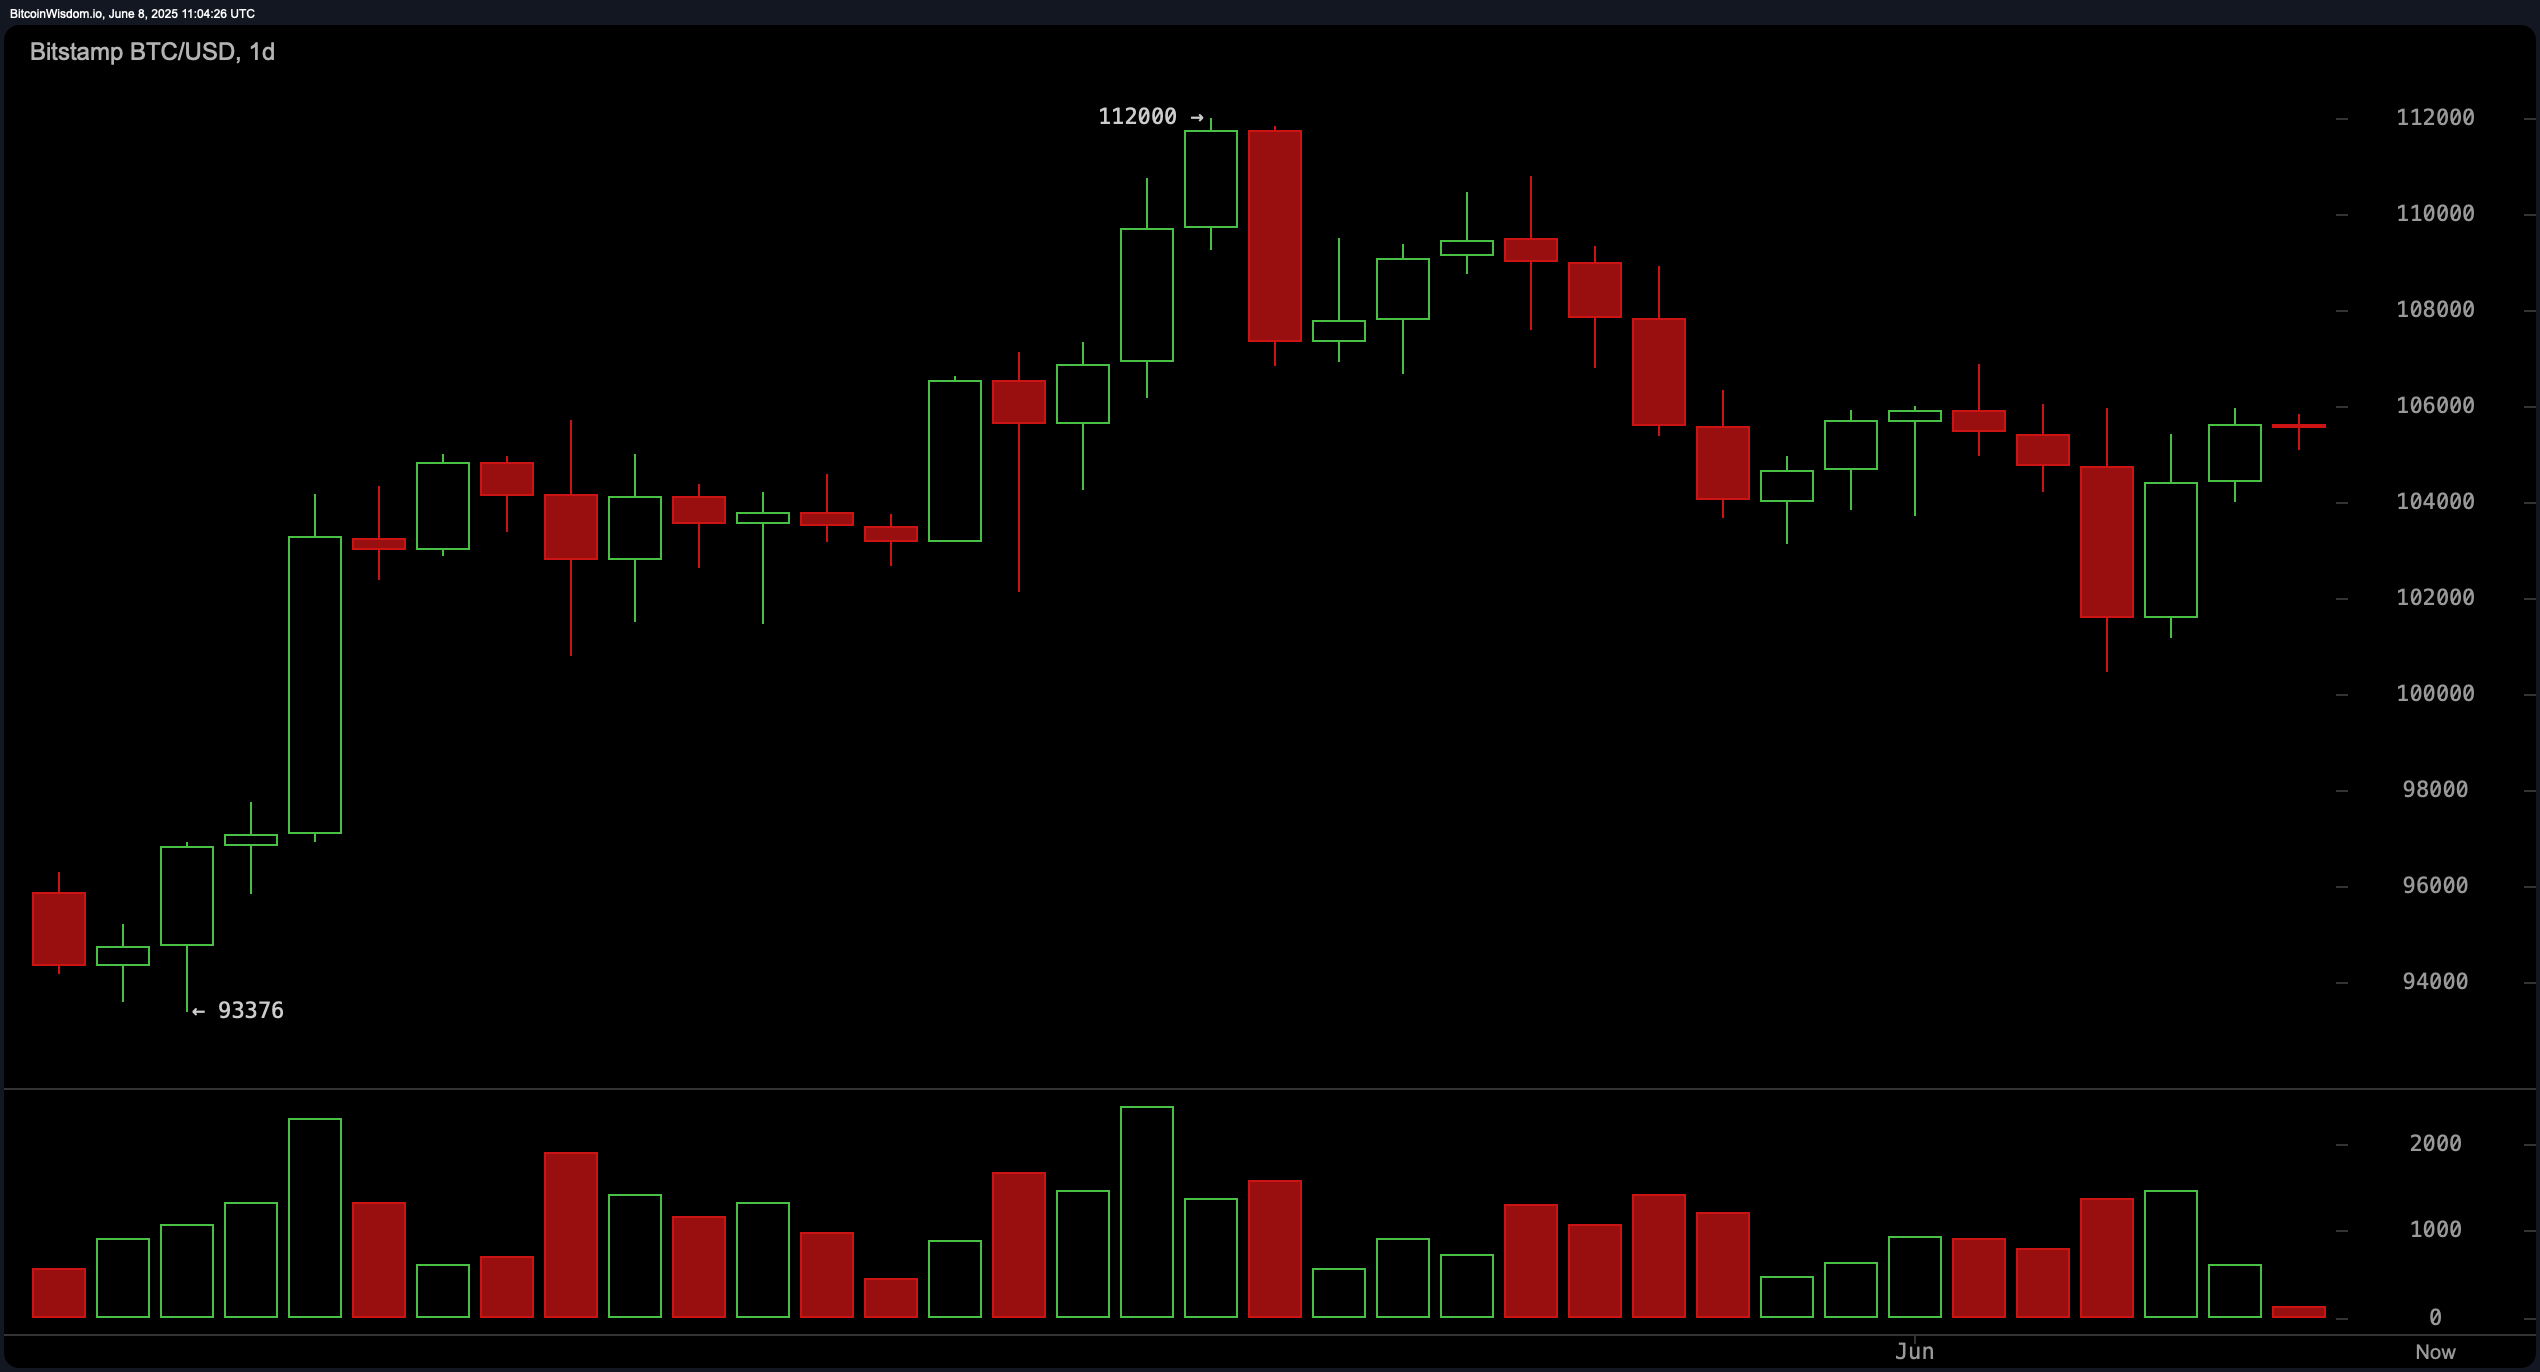
Daily BTC/USD chart data supports a bullish macro trend from late May into early June, peaking at $112,000 before experiencing a corrective retracement. The pullback found stability within the $100,000–$102,000 support zone, which has been tested multiple times. The price is now consolidating near $106,000–$108,000, suggesting a period of accumulation. For swing traders, a return to the $104,000–$105,000 range—especially with a long lower wick or a volume spike—may present a high-probability entry point. Profitable exits could be targeted at $108,000–$110,000, with stops recommended just below $102,000.
Oscillator readings provide mixed signals, with most indicators aligning in neutral territory. The relative strength index (RSI) at 53, Stochastic at 46, and commodity channel index (CCI) at −39 all reflect an indecisive market stance. The average directional index (ADX) at 20 reinforces this by suggesting a weak trend. Meanwhile, the Awesome oscillator and moving average convergence divergence (MACD) also lean neutral to bearish, with MACD indicating a negative bias. The momentum indicator, however, suggests positivity, signaling a potential upward thrust if supported by broader market sentiment.
Moving averages lend weight to the medium-to-long-term bullish outlook. Both the exponential moving average (EMA) and simple moving average (SMA) across 10, 20, 30, 50, 100, and 200-periods largely show buy signals. Notably, the 10-period EMA and SMA, standing at $105,142 and $104,756 respectively, support the current price, bolstering short-term bullishness. The 20-period EMA also confirms this with a value of $105,048, although the 20 and 30-period SMAs flash sell signals at $106,593 and $105,795. Longer-term averages—including the 100 and 200-period EMAs and SMAs—all favor buying, underlining structural strength beneath the price.
Bull Verdict:
Bitcoin remains structurally sound above critical support zones, with the majority of medium-to-long-term moving averages favoring further gains. A break above $106,800 with sustained volume would confirm bullish continuation, targeting $108,000 and beyond. Accumulation on dips to $104,500–$105,000 appears tactically favorable under current conditions.
Bear Verdict:
Despite its recent recovery, bitcoin faces mounting resistance near $106,800 and exhibits waning momentum on lower timeframes. Oscillators largely signal market indecision, and volume trends suggest a risk of false breakouts. Should support at $104,500 fail, a deeper pullback toward $102,000 or below remains a plausible scenario.