


 3
3
- Bitcoin price has been hovering around the $27,500 mark for the last couple of days.
- Over the past week, Bitcoin Cash and Bitcoin SV have accrued declines worth 11.6% and 16.13%, respectively.
- $BTC is once again nearing the point of a bearish crossover that could result in significantly higher losses.
Bitcoin price breached through the Exponential Moving Averages (EMA) this past week to trade above $27,500. The cryptocurrency has since been moving sideways; however, the declining bullishness spells trouble not only for $BTC but its hard fork tokens, Bitcoin Cash and Bitcoin SV, as well.
Bitcoin namesake tokens in the red
Bitcoin acts as a guide for the entire crypto market most of the time; however, it tends to have a slightly deeper impact on some tokens over others. These are the hard forks of Bitcoin, namely Bitcoin Cash ($BCH) and Bitcoin SV ($BSV). Even before the biggest cryptocurrency in the world prepares for a potential decline, its namesake altcoins have already dipped.
$BSV emerged as one of the biggest losers this past week as Bitcoin SV price crashed by more than 16% to trade at $33. In doing so, the altcoin has reached the point of testing the key support level of 50-day EMA.
$BSV/USD 1-day chart" src="https://cnews24.ru/uploads/911/9116d37391d8f65ff4f04e6bf17e14bc8d7c7640.png" size="1804x771">
$BSV/USD 1-day chart
Similarly, Bitcoin Cash price also declined by a little over 11%, resulting in the cryptocurrency changing hands at $217. Most of this decline came in the past 24 hours as $BTC also fell by 1.24%. This is the effect of Bitcoin sharing a high correlation with $BCH, which is presently at 0.88. This also spells good news for Bitcoin Cash as a recovery in $BTC price would be favorable to the altcoin.
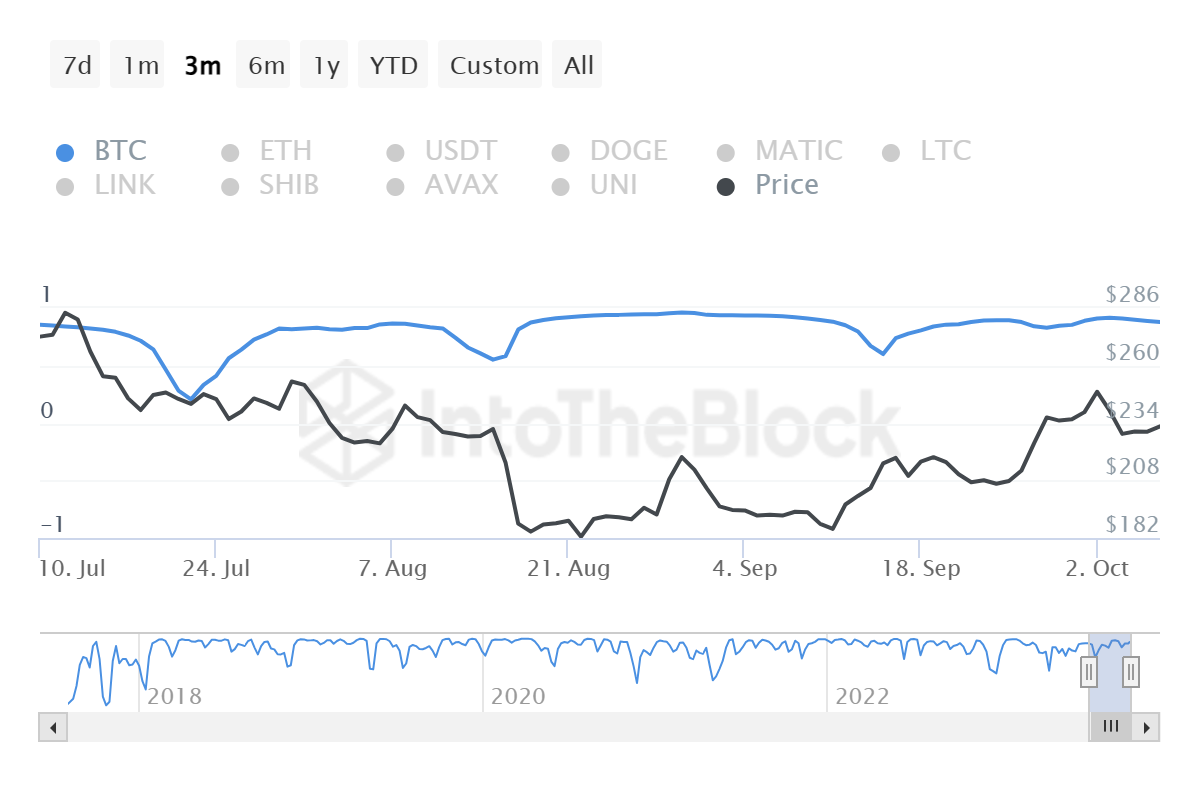
Bitcoin Cash correlation with Bitcoin
Bitcoin price recovery seems difficult
Bitcoin price is hovering around $27,500 at the time of writing, exhibiting chances of losing the support of the 100-day EMA as well as the support of $27,418. While the cryptocurrency would have the opportunity to bounce back from the confluence of the 50- and 200-day EMAs, the support at $26,430 would act as a safety net.
Losing this level would result in a crash below $25,000 for $BTC. The Moving Average Convergence Divergence (MACD) indicator is exhibiting a declining bullish momentum visible on the bars on the histogram. At the same time, the MACD line (blue) is nearing the signal line (red), and slipping below it would establish a bearish crossover that could trigger losses for $BTC.
$BTC/USD 1-day chart" src="https://cnews24.ru/uploads/afb/afb20f5267bff32bcd099bb3dd6081f622928a2e.png" size="1804x771">
$BTC/USD 1-day chart
But if Bitcoin price manages to sustain $27,418 as a support floor as it has for the past week, a breakdown is unlikely. Regardless, $BTC would need support from its investors in order to pull back up toward $30,000.


