


The broader crypto market pulled back 4.86% in 24 hours as of September 23, 2026, yet $UNI holds at 9.50 $USDT. The Uniswap price reflects a tension between a firmly bullish daily structure and fading momentum on shorter timeframes, creating a decisive moment for the token.
Key takeaways
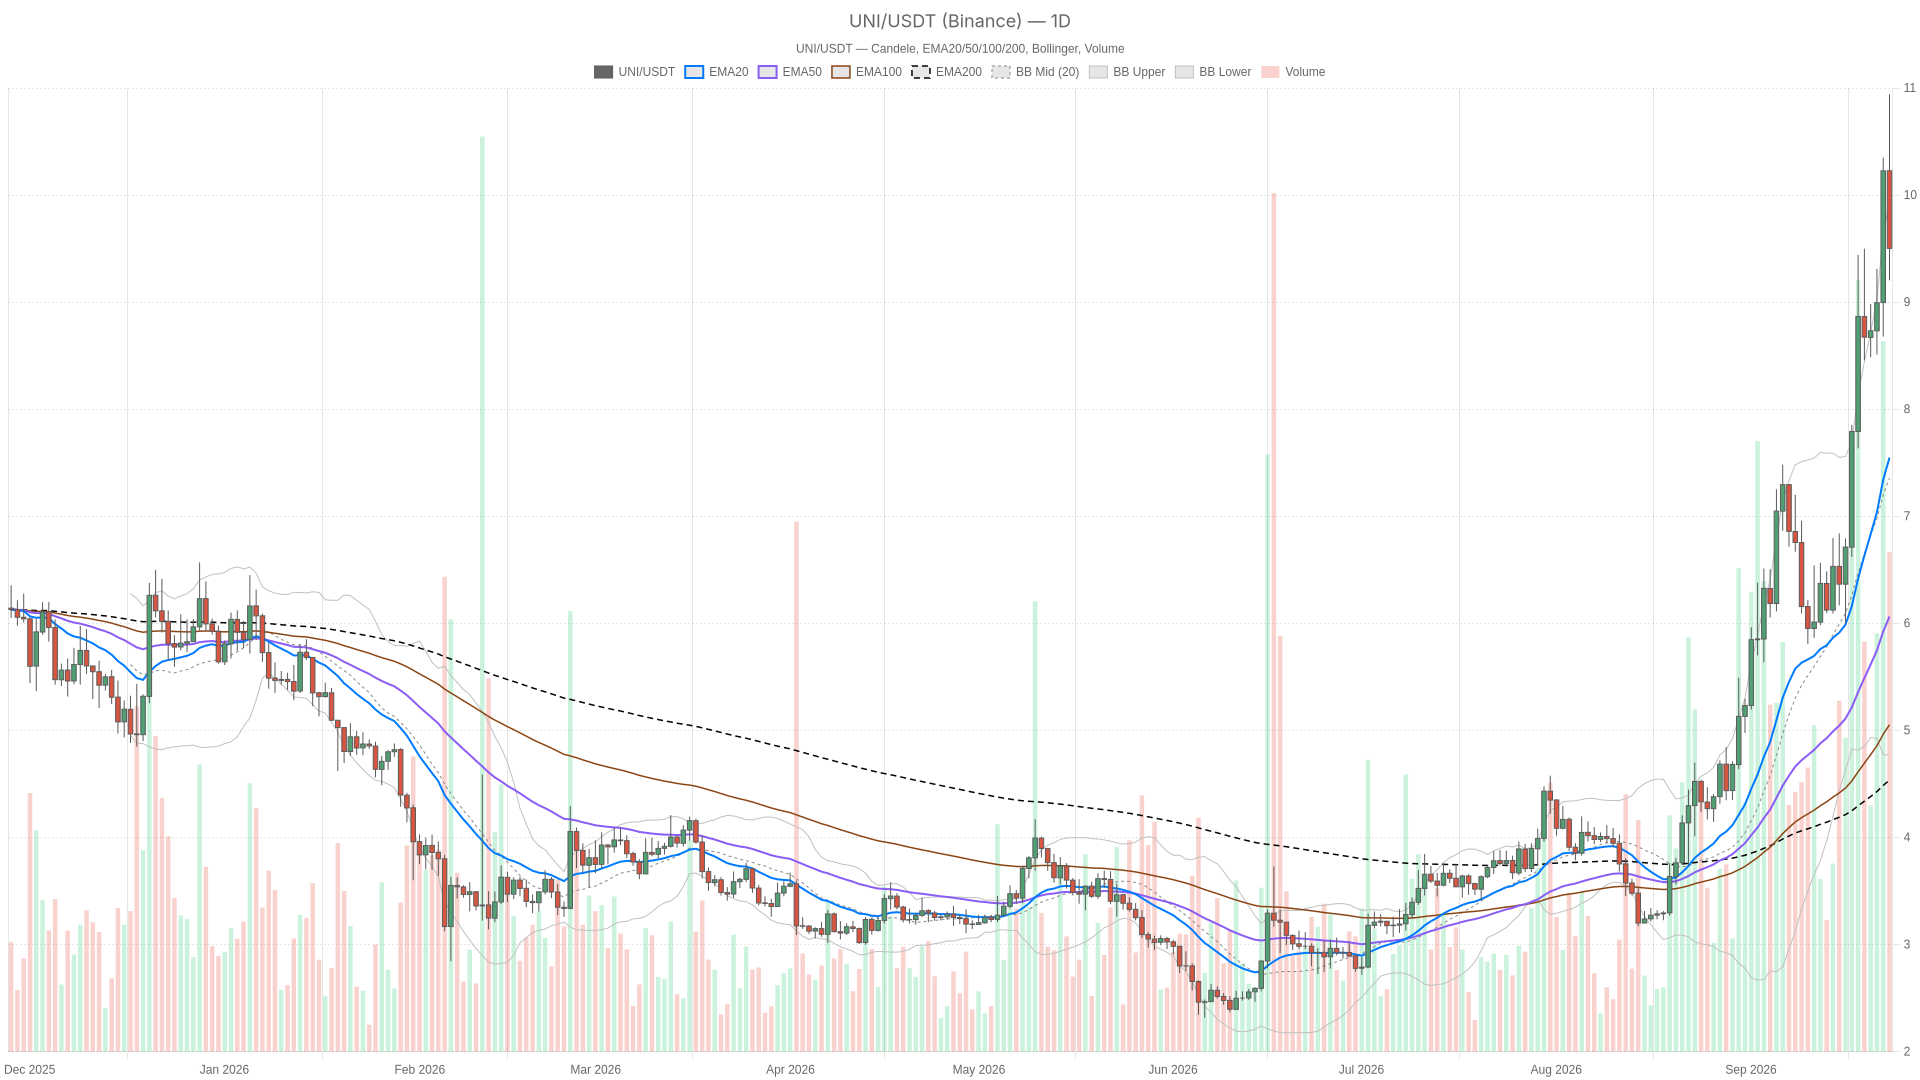
- $UNI trades at 9.50 $USDT, well above all three daily moving averages — EMA20 at 7.55, EMA50 at 6.06, and EMA200 at 4.54 — forming a clean bullish stack.
- Daily RSI at 71.76 signals overbought conditions, while the MACD remains positive with a histogram of 0.24.
- Short-term momentum is fading: 1H RSI sits at 42.36 and 15m RSI at 36.69, with both MACD histograms negative.
- Total crypto market capitalization fell 4.86% in 24 hours, adding external pressure to an already stretched daily trend.
- Key support levels to watch are 9.44 (short-term pivot cluster) and 8.82 (daily pivot support).
Daily chart: the trend remains structurally bullish
The daily trend for $UNI remains structurally bullish. Price trades well above the EMA20 at 7.55, EMA50 at 6.06, and EMA200 at 4.54 — a clean bullish stack indicating a sustained uptrend rather than a short-lived bounce.
However, RSI at 71.76 sits deep in overbought territory, where pullbacks grow more probable simply because little fuel remains for a straight-line continuation. The MACD remains constructive, with the line at 1.13 above the signal at 0.88 and a positive histogram of 0.24, though momentum appears stretched. Moreover, price is pressing against the upper Bollinger Band at 9.95, with the mid-band at 7.36 and the lower band at 4.77. When price rides the upper band this tightly, any pause could trigger a snap back toward the middle. A daily ATR of 0.93 suggests near-dollar swings are entirely normal, making a move toward the daily pivot support at 8.82 structurally insignificant.
1-hour chart: short-term momentum is cooling
Short-term momentum on the 1-hour chart is clearly cooling rather than reversing. Price at 9.50 now trades below the EMA20 at 9.83 but stays above the EMA50 at 9.54 — a textbook cooling-off pattern after a strong run.
RSI at 42.36 is neutral, far from the enthusiasm the daily chart displays, while the MACD histogram has flipped negative at -0.15, with the MACD line at 0.04 now under its signal at 0.19. None of this signals a reversal, but it does confirm the buyers who drove the daily trend higher are not actively pressing. The 1H Bollinger Bands — upper at 10.96, mid at 10.08, lower at 9.20 — show price drifting toward the lower half of its recent range, and the tight pivot cluster of R1 at 9.54 and S1 at 9.44 creates a narrow battleground for the next move.
15-minute chart: sellers are testing the floor
The 15-minute chart confirms sellers are testing short-term support levels. Price sits below both the EMA20 at 9.65 and EMA50 at 9.87, RSI has slipped to 36.69, and the MACD line and signal are essentially flat and negative at -0.19.
That said, this is intraday chop rather than a decisive breakdown, though it confirms momentum has turned defensive in the very short term. The 15m pivot support at 9.44 lines up almost exactly with the 1H support, making that level particularly significant. A clean loss on strong volume would carry more weight precisely because multiple timeframes agree on it.
What would confirm the bullish case
The bullish scenario for $UNI stays intact as long as the daily uptrend structure holds. Price needs to defend the 1H EMA50 near 9.54 and, more importantly, avoid breaking below the daily pivot support at 8.82.
If buyers step back in around these levels, a resumption of the daily trend would likely target the daily R1 at 10.56, with the upper Bollinger Band near 9.95 acting as the first real test. Given how overbought the daily RSI already is, however, a fresh leg higher would need genuine volume behind it rather than a thin, low-conviction push. Otherwise it risks simply re-testing the same overbought ceiling without follow-through.
What would confirm the bearish case
The bearish scenario gains traction if price loses the 9.44 support that both the 1H and 15m pivots identify. A clean break there would open the door toward the daily EMA20 at 7.55 and the Bollinger mid-band at 7.36 — a much deeper retracement than the current cooling-off phase suggests.
This is not unreasonable given the daily ATR of 0.93 and ample room for RSI to unwind from 71.76 toward neutral. Moreover, the scenario becomes more credible if broader market weakness persists, since altcoins tend to underperform when capital rotates defensively. BTC dominance at 58.77% already shows where the market’s comfort money sits right now.
On-chain activity confirms the cooling trend
On-chain activity on Uniswap confirms the cooling trend visible on lower timeframes. According to DefiLlama fee data, Uniswap V3 fees fell 38.52% in the last 24 hours and are down 8.9% over 7 days, while Uniswap V4 fees dropped 10.99% daily but remain up 69.89% over 30 days.
This suggests a slow migration of activity toward V4 even as overall trading activity has cooled sharply in the short term. That kind of fee slowdown across both versions mirrors what the lower timeframes show: less aggressive participation, consistent with a market taking a breath rather than making a decisive directional bet.
Positioning and risk
The honest assessment is that the daily chart and shorter timeframes remain in unresolved tension. The Uniswap price trend on the daily is unambiguously bullish, yet overbought and riding the upper Bollinger Band, while the 1H and 15m charts show momentum fading and price testing support clusters around 9.44–9.54.
This is not a setup that rewards strong conviction in either direction until one of those levels breaks decisively. Volatility remains elevated — daily ATR near 0.93 and a broader market that just shed nearly 5% of its total capitalization in a day — so whichever way this resolves, the move could be sharp. Anyone watching this pair should focus on whether the 8.82 daily support and the 9.44 short-term support hold, because those two levels, more than any single indicator, will likely decide which scenario plays out next.
FAQ
What does the daily chart show for $UNI right now?
The daily trend for $UNI remains firmly bullish as of September 23, 2026. Price trades well above the EMA20 at 7.55, EMA50 at 6.06, and EMA200 at 4.54, forming a clean bullish stack. However, RSI at 71.76 signals overbought conditions that increase the likelihood of a short-term pullback, even as the MACD histogram remains positive at 0.24.
What are the key support levels for $UNI right now?
The most immediate support sits at 9.44, where both the 1-hour and 15-minute pivot supports converge. Below that, the daily pivot support at 8.82 represents a more significant structural level. A break below 9.44 would open the path toward the daily EMA20 at 7.55 and the Bollinger mid-band at 7.36, representing a deeper retracement.
Is short-term momentum for Uniswap bullish or bearish?
Short-term momentum has turned defensive but is not yet bearish. On the 1-hour chart, RSI sits at a neutral 42.36 and the MACD histogram has flipped negative at -0.15. The 15-minute chart shows similar weakness with RSI at 36.69. These readings suggest cooling rather than reversal, with price still holding above the key support cluster at 9.44.
Disclaimer: This article is for informational purposes only and does not constitute financial advice, an investment recommendation, or a solicitation to buy or sell any financial instrument or cryptocurrency. The analysis provided is not indicative of future results. Investing in crypto assets and financial markets carries a high risk of capital loss. Always do your own research (DYOR) and consult a qualified financial advisor before making any decision.
Article produced with the assistance of artificial intelligence and reviewed by the editorial team.

 ambcrypto.com

 finbold.com
