


 1
1
Zcash ($ZEC) is trading just below a key resistance zone after a strong breakout, with price now entering a critical decision phase. While the broader structure remains bullish, the chart suggests a possible liquidity sweep toward lower levels before any attempt to break above $1,595.
Week 1 Range Sets the Higher-Timeframe Reference
Week 1 established the main reference range between approximately $1,054.48 and $1,296.02.
$ZEC initially traded inside this band after its earlier rally. Price tested both sides before buyers eventually pushed through the upper boundary.
The $1,296.02 level is important because it marks the Week 1 high. A move above that level shifted price into a new expansion phase.
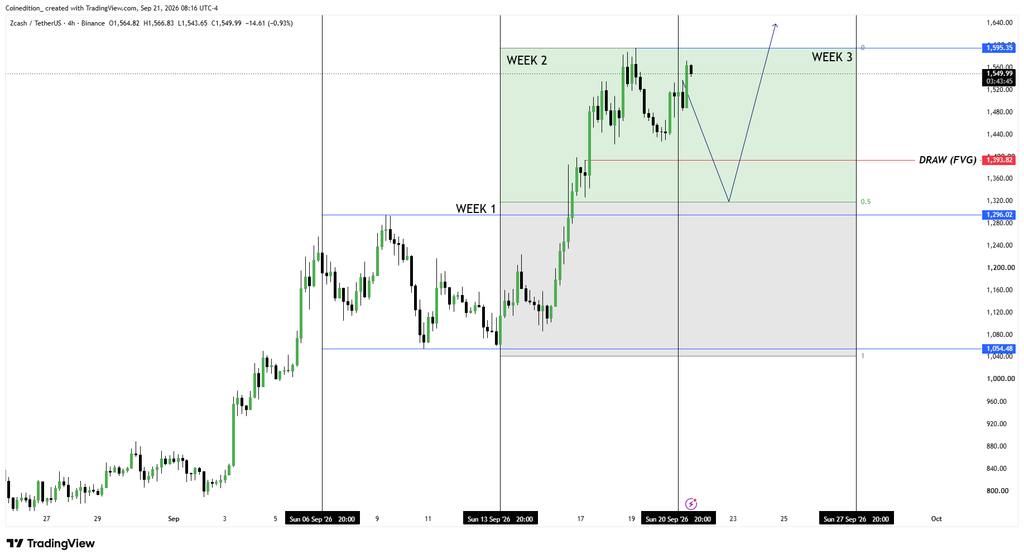
The chart shows $ZEC accelerating after the breakout. Several large bullish candles carried price through $1,300 and toward $1,500.
That move changed the higher-timeframe structure. Week 1 therefore provides the base used to judge the current Week 3 setup.
Week 2 Bullish Close Establishes the Expansion
Week 2 produced the strongest part of the move. $ZEC advanced from the Week 1 breakout area and reached highs near $1,595.35. Price then experienced several pullbacks, but buyers continued defending higher levels.
The bullish Week 2 close confirmed acceptance above the previous weekly range. It also established $1,595.35 as the main high above the current price.
At the time shown on the chart, $ZEC trades near $1,549.99. The latest four-hour candle records a high near $1,566 and a low around $1,543.
Price therefore sits close to the Week 2 high but has not yet produced sustained acceptance above it.
Week 3 Could First Sweep Sell-Side Liquidity
The projected Week 3 path does not show a straight move higher. Instead, the chart allows $ZEC to retrace first and collect liquidity below the current price. The projected move extends toward the lower portion of the Week 2 structure before reversing.
A deeper sweep could bring the $1,393.82 fair value gap into focus. This area formed during the rapid Week 2 expansion.
The chart also marks a midpoint near the lower half of the current weekly range. That zone could act as another reference if sellers push the price lower.
A liquidity sweep would not automatically confirm a reversal. Traders would need to watch whether $ZEC quickly reclaims the swept area and begins producing higher four-hour closes.
FVG Draw and Continuation Toward $1,595.35
The $1,393.82 FVG is the main intermediate draw shown below the current price.
Fair value gaps form when rapid price movement leaves an imbalance between consecutive candles. Markets can later revisit these zones during retracements.
If $ZEC moves into that area and recovers, attention would return to the Week 2 high.
The first continuation test sits at $1,595.35. A sustained Week 3 close above that level would place the price outside the previous weekly high.
The chart’s projected path then extends above $1,600, although that move has not occurred.
Continuation Case
A pullback followed by a reclaim of the Week 3 range would preserve the bullish structure.
A sustained four-hour or weekly move above $1,595.35 would confirm price has cleared the Week 2 high.
Failure Case
A prolonged move below $1,393.82 would weaken the immediate recovery structure.
A break below $1,296.02 would place $ZEC back beneath the Week 1 breakout level and weaken the Week 3 continuation setup.
Bottom Line
$ZEC enters Week 3 near the top of its recent expansion. The chart allows a liquidity sweep first, with $1,393.82 marking the main downside draw.
The continuation level stays at $1,595.35. A sustained break above that price would extend the Week 2 bullish structure.
FAQs
Yes. The chart projects a pullback toward lower liquidity before another possible attempt at the Week 2 high.
It marks an imbalance created during the Week 2 expansion and sits below the current price.
It confirms price accepted above the $1,296.02 Week 1 high and expanded into a higher range.
It marks the Week 2 high and the main liquidity level directly above the current price.
Sustained trading below $1,393.82 would weaken momentum, while losing $1,296.02 would damage the broader breakout structure.
Related: Zcash Price Prediction: Short Sellers Get Squeezed as $ZEC Tops $23 Billion Market Cap

 ambcrypto.com
 thecryptobasic.com


 invezz.com