


 2
2
$XRP Breaks Above Falling Channel as RSI Rises, $1.60 Becomes Next Technical Level.
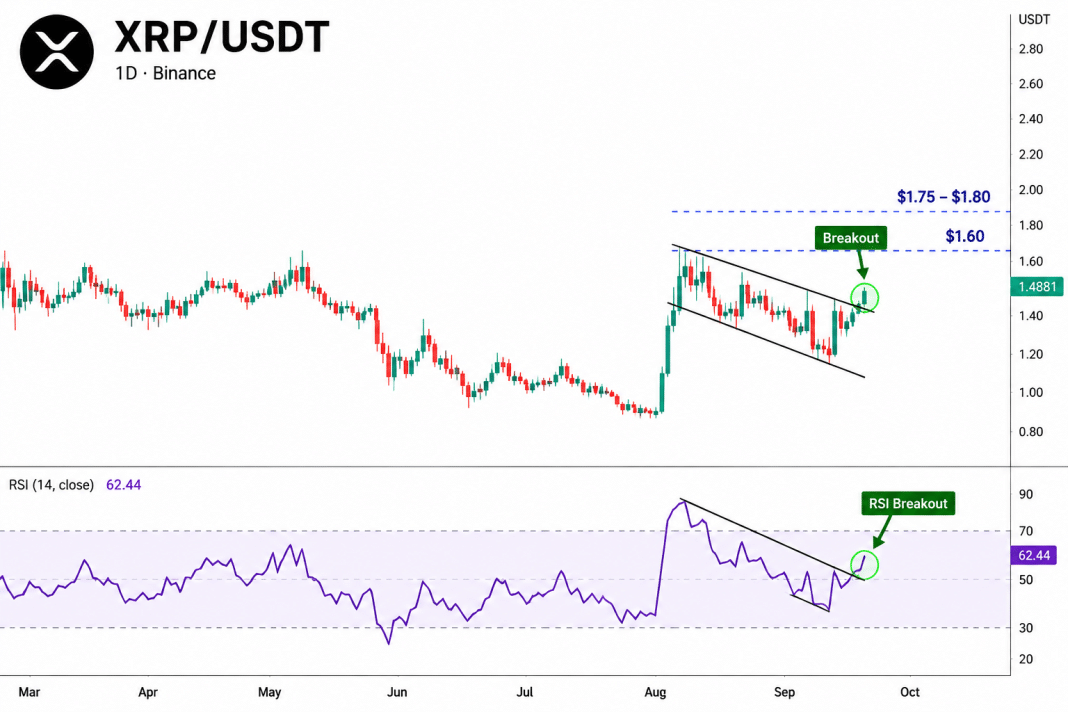
$XRP has moved above a descending price channel on the daily chart, while its Relative Strength Index has also broken above a short-term declining structure. The chart places $XRP near $1.49, with RSI at approximately 62.44.
The breakout follows several weeks of consolidation after $XRP’s sharp August recovery. Price had been trading inside a downward-sloping channel formed after an advance from around $1.00 to above $1.50. The latest candles show $XRP moving through the channel’s upper boundary and returning toward the highs of the recent consolidation range.
RSI Moves Above Its Descending Structure
The RSI provides a second technical development on the chart. After reaching above 80 during the initial August price surge, the indicator declined inside its own falling channel as $XRP consolidated.
The latest reading around 62.44 places RSI above the descending resistance line drawn across its recent highs. It also remains below the standard 70 overbought threshold shown on the chart.
The price and RSI breakouts are occurring at approximately the same point in the daily structure.
$1.60 Remains the Next Major Level
The next displayed price area aligns with the $1.60 level highlighted in previous on-chain data.
As previously reported, Glassnode’s $XRP URPD data showed approximately 2.5 billion $XRP previously changed hands around $1.60, making it one of the largest nearby concentrations of historically transacted supply. The same dataset showed considerably less $XRP concentrated around the intervening price levels.
From the approximately $1.49 price shown on the latest chart, a move to $1.60 would represent an increase of about 7.4%.
Above $1.60, the technical levels supplied with the chart place the next area at approximately $1.75 to $1.80. From $1.60, those levels are another 9.4% to 12.5% higher.
The most recent daily candle also shows an extended upper wick above the channel boundary, indicating that price traded higher during the session before returning toward $1.49. The preceding candles show a rebound from the lower portion of the channel followed by consecutive movement toward its upper boundary.
The chart therefore currently shows $XRP above its falling price channel, RSI at 62.44 and above its own descending structure, with $1.60 representing the next specified technical level and $1.75–$1.80 positioned above it.

 ambcrypto.com


 invezz.com