


$XRP bears are currently facing resistance on the back of the recent rebound, but chart data suggests the downtrend may not be over.
$XRP started the week under strong selling pressure after the U.S. Senate failed to advance the CLARITY Act, a bill that could have provided more regulatory clarity for digital assets.
The setback removed an important bullish factor for $XRP and sent the token down to the $1.29-$1.30 range as sellers moved in. Since the SEC case, $XRP has had links to U.S. regulatory developments, which made the Senate setback particularly important for the token.
$XRP Records Bearish BoS
On the 4-hour chart, $XRP recorded a bearish Break of Structure (BoS) after falling below the $1.3325 swing low and closing at $1.2951.
The move took $XRP below the broken support and the lower volatility band at $1.3023. At the same time, the EMA21 stood at $1.3585, while the EMA55 remained at $1.3726. Both moving averages stayed above the price, which created a strong resistance area.
The previous major swing high at $1.4961 had also remained untouched for eight bars, and this added to the signs of weak buying pressure.
$XRP had already moved beyond its 1.5x ATR (Average True Range) envelope, showing that the decline had moved quickly and covered a large range in a short period. Such a sharp move can leave room for a temporary recovery before the next major price move.
The structure suggests $XRP could see a possible recovery toward the $1.3325-$1.3585 area. In this scenario, the former support at $1.3325 could turn into resistance, while the EMA21 at $1.3585 could limit the recovery.
A rejection from that area would strengthen the case for another decline toward $1.2450, followed by the psychological $1.20 level and potentially $1.10 if selling pressure increased.
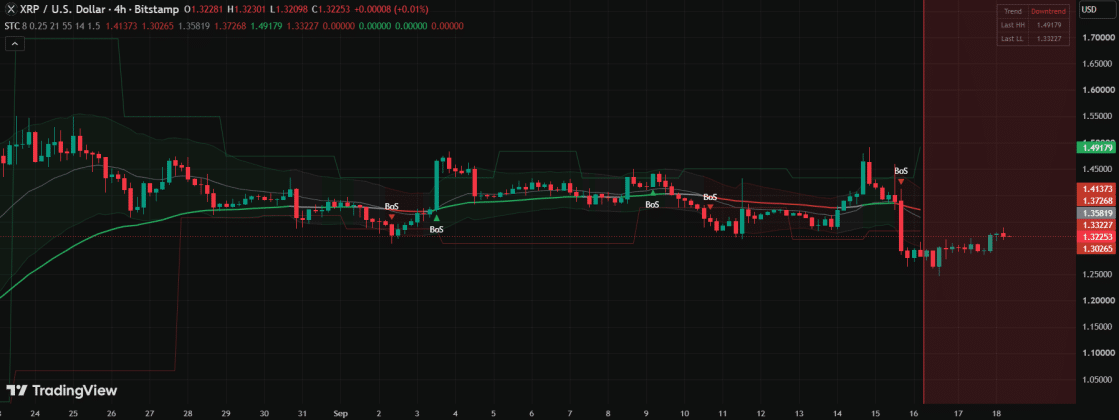
The key level that could invalidate the bearish setup remains the EMA55 at $1.3726. A 4-hour close above that level would weaken the bearish case and remove the basis for the lower targets.
Notably, the selling pressure also appeared in longer-term momentum, as $XRP’s two-week RSI fell to around 33.5, the lowest reading shown across 13 years of $XRP trading history.
Where $XRP Stands Today
Interestingly, buyers have since returned, leading to a mild $XRP recovery. The token now trades around $1.33, up 2.4% over the past 24 hours, with trading volume above $2.48 billion. The broader recovery across the cryptocurrency market has also helped support $XRP.
Bitcoin and Ethereum have also joined the recovery, trading above $78,000 and $2,500, at press time. This broader improvement has given $XRP some support after the decline earlier in the week.
The daily chart now shows a more balanced market. $XRP at $1.33 sits between the daily EMA20 at $1.34 and the EMA50 at $1.29, while the price remains almost exactly at the EMA200 of $1.33. The daily RSI at 49.56 sits near the middle of its range.
The Key Question Now
Shorter timeframes now show stronger buying pressure. The 1-hour RSI stands at 65.02, while the 15-minute RSI is at 66.85. Both readings suggest that buyers have gained some strength in the short term.
The main area to watch remains $1.32-$1.34, which matches the zone identified in the earlier bearish setup. A break above this range could open the way toward $1.37 and then $1.46. Still, $XRP needs to move through the wider resistance structure before the recent recovery can fully challenge the bearish setup.
Despite the ongoing rebound push, the original bearish structure remains relevant. $XRP now trades closer to the $1.3726 EMA55 level that would invalidate the bearish setup.
A 4-hour close above $1.3726 would invalidate the structure and bring the $1.4961 swing high back into focus. On the other hand, a rejection from the current $1.33-$1.37 area would keep the downside levels at $1.2450, $1.20, and $1.10 relevant.

 ambcrypto.com
 coinpedia.org
 decrypt.co