

 1
1
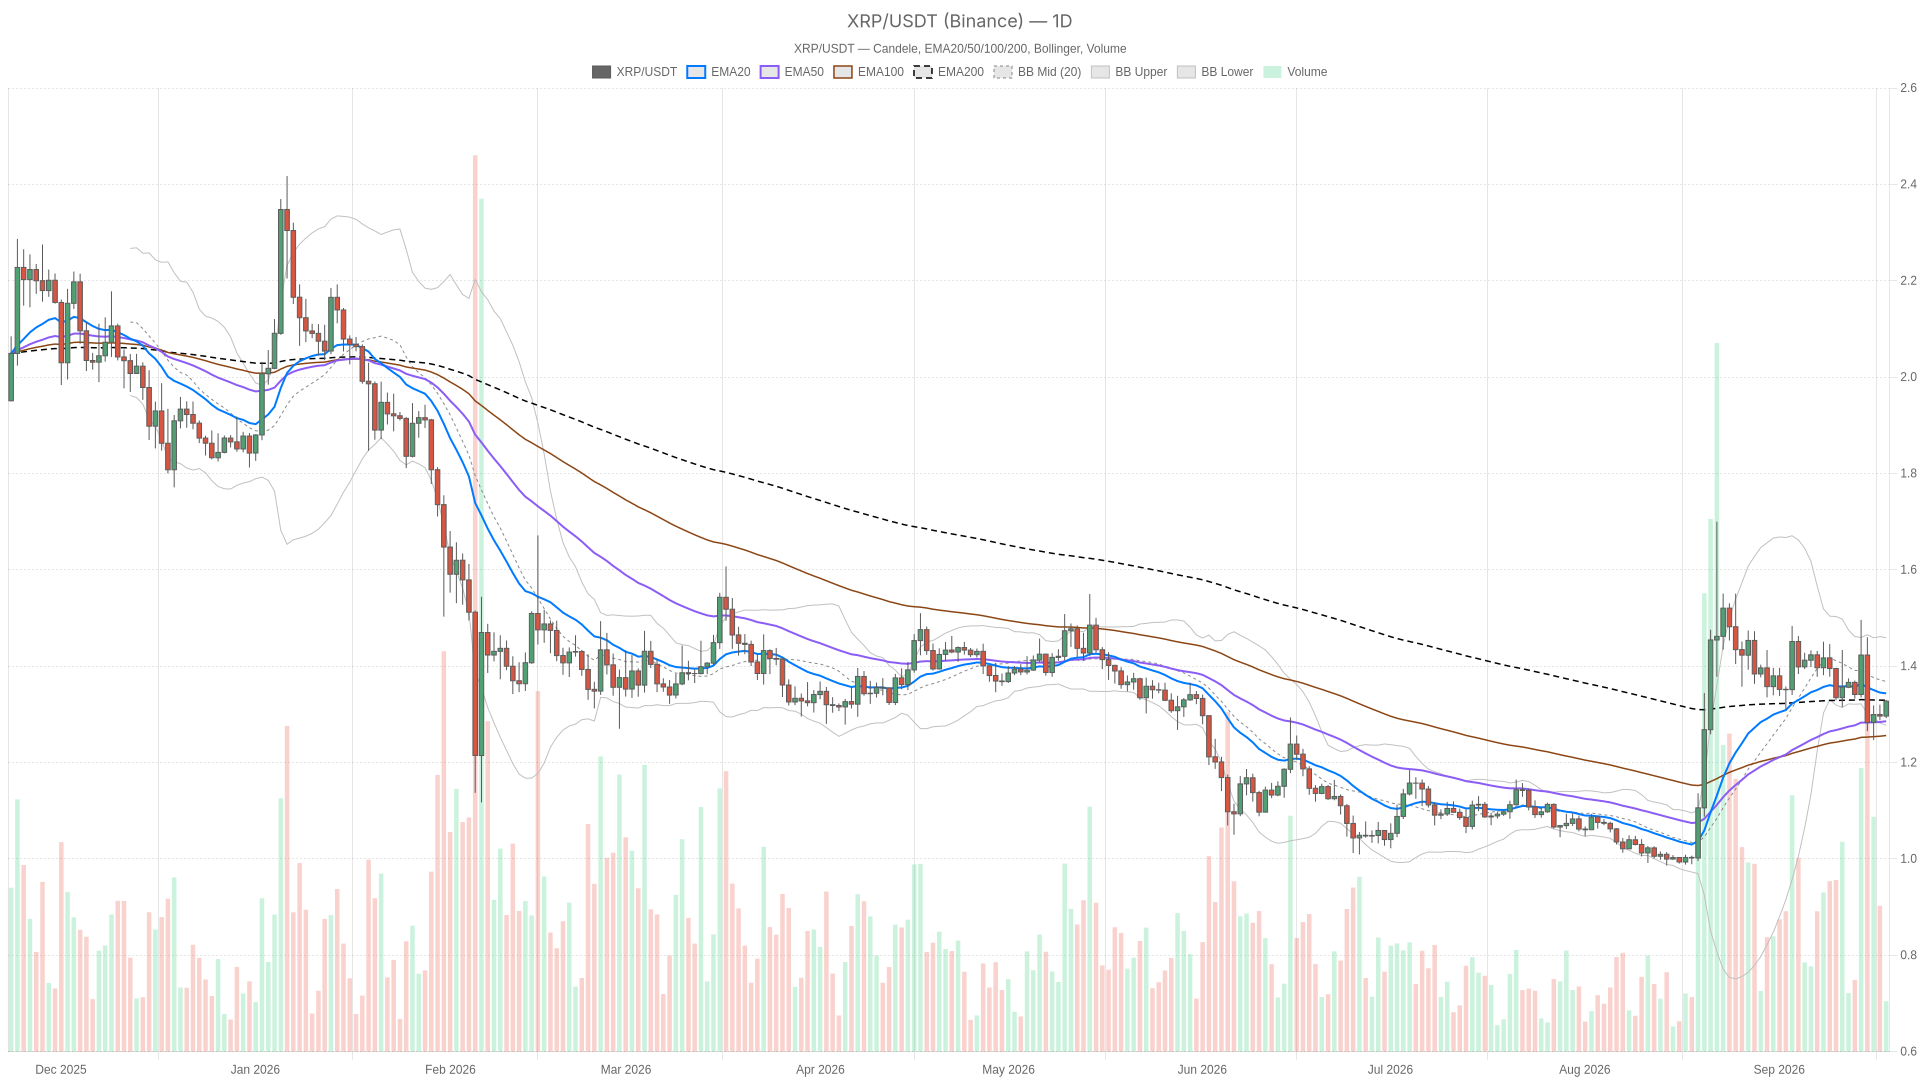
As of September 18, 2026, $XRP is parked at $1.33, trapped between its daily moving averages in a compression zone where neither buyers nor sellers have taken control. The Ripple price today reflects a waiting game, though shorter-term charts are quietly building bullish pressure underneath the surface.
Key takeaways
- $XRP trades at $1.33 on September 18, 2026, compressed between the daily EMA20 at $1.34 and EMA50 at $1.29
- Daily RSI14 reads 49.56 — dead neutral — while the MACD histogram at -0.02 signals a mild bearish momentum tilt
- Short-term charts diverge: 1H RSI sits at 65.02 and 15m RSI at 66.85, indicating building bullish pressure
- The $1.32–$1.34 zone is the critical battleground; a breakout above opens the path toward $1.37 and eventually $1.46
- Bitcoin dominance near 58% and total crypto market cap at $2.678 trillion offer no strong tailwind for $XRP
Daily chart sets a neutral macro bias
On the daily timeframe, the regime is officially neutral, and the indicators back that up almost indicator-by-indicator. RSI14 sits at 49.56 — dead center, signalling no directional conviction either way. That is the market telling you it has not picked a side yet.
The MACD paints a slightly more cautious picture, however. The MACD line is at 0.01 against a signal line of 0.03, leaving a negative histogram of -0.02. That amounts to a mild bearish tilt in daily momentum, even if it is far from dramatic. It is the kind of reading that says sellers still have a slight edge on momentum, while price holds steady.
The EMA structure reinforces the compression story. Price at $1.33 is squeezed between EMA20 ($1.34) above and EMA50 ($1.29) below, while sitting almost exactly on the EMA200 at $1.33. When all three moving averages converge like this, it usually means the market is coiling before a bigger directional decision rather than committing to a trend.
Bollinger Bands add another layer: the mid-band sits at $1.37, well above current price, with the upper band at $1.46 and the lower band at $1.28. Price sitting below the midline but still above the lower band suggests $XRP is in the lower half of its recent volatility range — not oversold, but not showing strength either. Moreover, daily ATR14 at $0.07 confirms this is a market with real room to move once it decides on direction.
Pivot levels frame the battle lines clearly: the daily pivot point sits at $1.32, with resistance at R1 $1.34 and support at S1 $1.30. Price hovering just above the pivot and testing R1 means bulls are pushing but have not cleared the first real hurdle yet.
Short-term momentum tells a different story
This is where the tension in the chart becomes obvious. On the 1-hour timeframe, RSI14 has climbed to 65.02 — a meaningfully stronger reading than the daily’s neutral 49.56, showing real short-term buying interest. That said, the MACD line and signal are both flat near zero, which means momentum is present but not accelerating.
The 1H EMA picture is mixed on purpose: price at $1.33 trades above both EMA20 and EMA50 (both at $1.31), but remains below the EMA200 at $1.35. That describes a market that has reclaimed short-term control without yet flipping the broader intraday trend. The 1H Bollinger upper band at $1.33 lines up almost exactly with spot price, hinting that the pair is pressing against short-term resistance rather than breaking cleanly through it.
Zoom into the 15-minute chart and the bullish tilt gets more explicit. This is the only timeframe explicitly tagged as a bullish regime. RSI14 here reads 66.85, and price is trading above all three EMAs — 20, 50, and 200 — clustered tightly between $1.31 and $1.32. That alignment is a genuine short-term uptrend structure, even if it is happening inside a much larger daily range that has not picked a direction.
The disagreement between timeframes is the real story right now: the daily chart is neutral with a slight bearish momentum lean, the 1-hour chart shows strength running into resistance, and the 15-minute chart is outright bullish. That is not necessarily contradictory — it often means buyers are testing the market in short bursts while the bigger daily structure decides whether it wants to follow.
Bullish scenario for $XRP
If $XRP can push through the daily EMA20 at $1.34 and clear the R1 pivot at the same level, the path opens toward the daily Bollinger mid-band at $1.37 and eventually the upper band near $1.46. For this to hold, the 1H RSI needs to keep pushing above 65 without immediately rolling over at that $1.33 upper band. Meanwhile, the 15-minute bullish regime needs to keep printing higher lows rather than fading.
This scenario would essentially confirm that the short-term strength on the lower timeframes is finally dragging the daily chart out of its neutral compression. What would invalidate it: a rejection right at the $1.34 EMA20/R1 zone, especially if the daily MACD histogram stays negative or widens further. If price cannot hold above the daily pivot at $1.32, the bullish case on the lower timeframes starts to look like a short-lived bounce rather than the start of something bigger.
Bearish scenario for $XRP
The bearish case leans on the daily MACD’s negative histogram and the fact that price is still trading below the Bollinger mid-band. If $XRP loses the pivot at $1.32 and then the S1 support at $1.30, the daily EMA50 at $1.29 becomes the next real test, with the lower Bollinger Band at $1.28 not far behind. A breakdown of that magnitude would likely drag the 1H and 15m RSI readings back down from their current mid-60s levels.
That chain of events would effectively erase the short-term bullish tilt that is currently propping up the intraday picture. However, what would invalidate this scenario is a reclaim and hold above the $1.34 daily resistance, paired with the MACD histogram flipping positive. As long as the shorter timeframes keep showing RSI above 60 and price keeps respecting their EMAs, the bearish case remains more of a risk to monitor than an active trend.
Positioning and risk going into the next move
Right now, $XRP is a market caught between a daily chart that refuses to commit and shorter-term charts that are leaning bullish but have not broken anything decisive. That is the kind of setup where chasing either direction aggressively is a good way to get caught in a whipsaw. The daily ATR of $0.07 alone tells you there is enough volatility here to swing sentiment quickly in either direction.
With Bitcoin dominance still elevated near 58% and total market capitalization slipping slightly over the past day, the macro backdrop is not giving $XRP a strong tailwind either way. Consequently, even more weight falls on how this daily compression resolves. The Fear & Greed Index reading of 56 suggests traders are not panicking, but they are also not all-in — a fitting mood for a chart that is genuinely undecided.
Anyone watching the Ripple price today should treat the $1.32–$1.34 zone as the real battleground: what happens there over the next sessions will likely tell you far more than any single indicator reading in isolation. Given the mixed signals across timeframes, this is a moment for patience and clearly defined levels rather than conviction in either direction.
FAQ
What is the Ripple price today?
As of September 18, 2026, $XRP is trading at approximately $1.33, sitting almost exactly on its daily EMA200. The price is compressed between the EMA20 at $1.34 above and the EMA50 at $1.29 below, creating a tight consolidation zone.
Is $XRP bullish or bearish right now?
The picture is split across timeframes. The daily chart is neutral with a slight bearish momentum lean (RSI14 at 49.56, MACD histogram at -0.02). However, the 1-hour chart shows strengthening buying interest with RSI at 65.02, while the 15-minute chart is outright bullish with RSI at 66.85 and price above all three EMAs.
What are the key levels to watch for $XRP?
The critical battleground is the $1.32–$1.34 zone. A break above $1.34 opens the path toward $1.37 and eventually $1.46. On the downside, losing $1.32 would expose S1 at $1.30, followed by the daily EMA50 at $1.29 and the lower Bollinger Band at $1.28.
Disclaimer: This article is for informational purposes only and does not constitute financial advice, an investment recommendation, or a solicitation to buy or sell any financial instrument or cryptocurrency. The analysis provided is not indicative of future results. Investing in crypto assets and financial markets carries a high risk of capital loss. Always do your own research (DYOR) and consult a qualified financial advisor before making any decision.
Article produced with the assistance of artificial intelligence and reviewed by the editorial team.

 ambcrypto.com
 coinpedia.org
 decrypt.co