


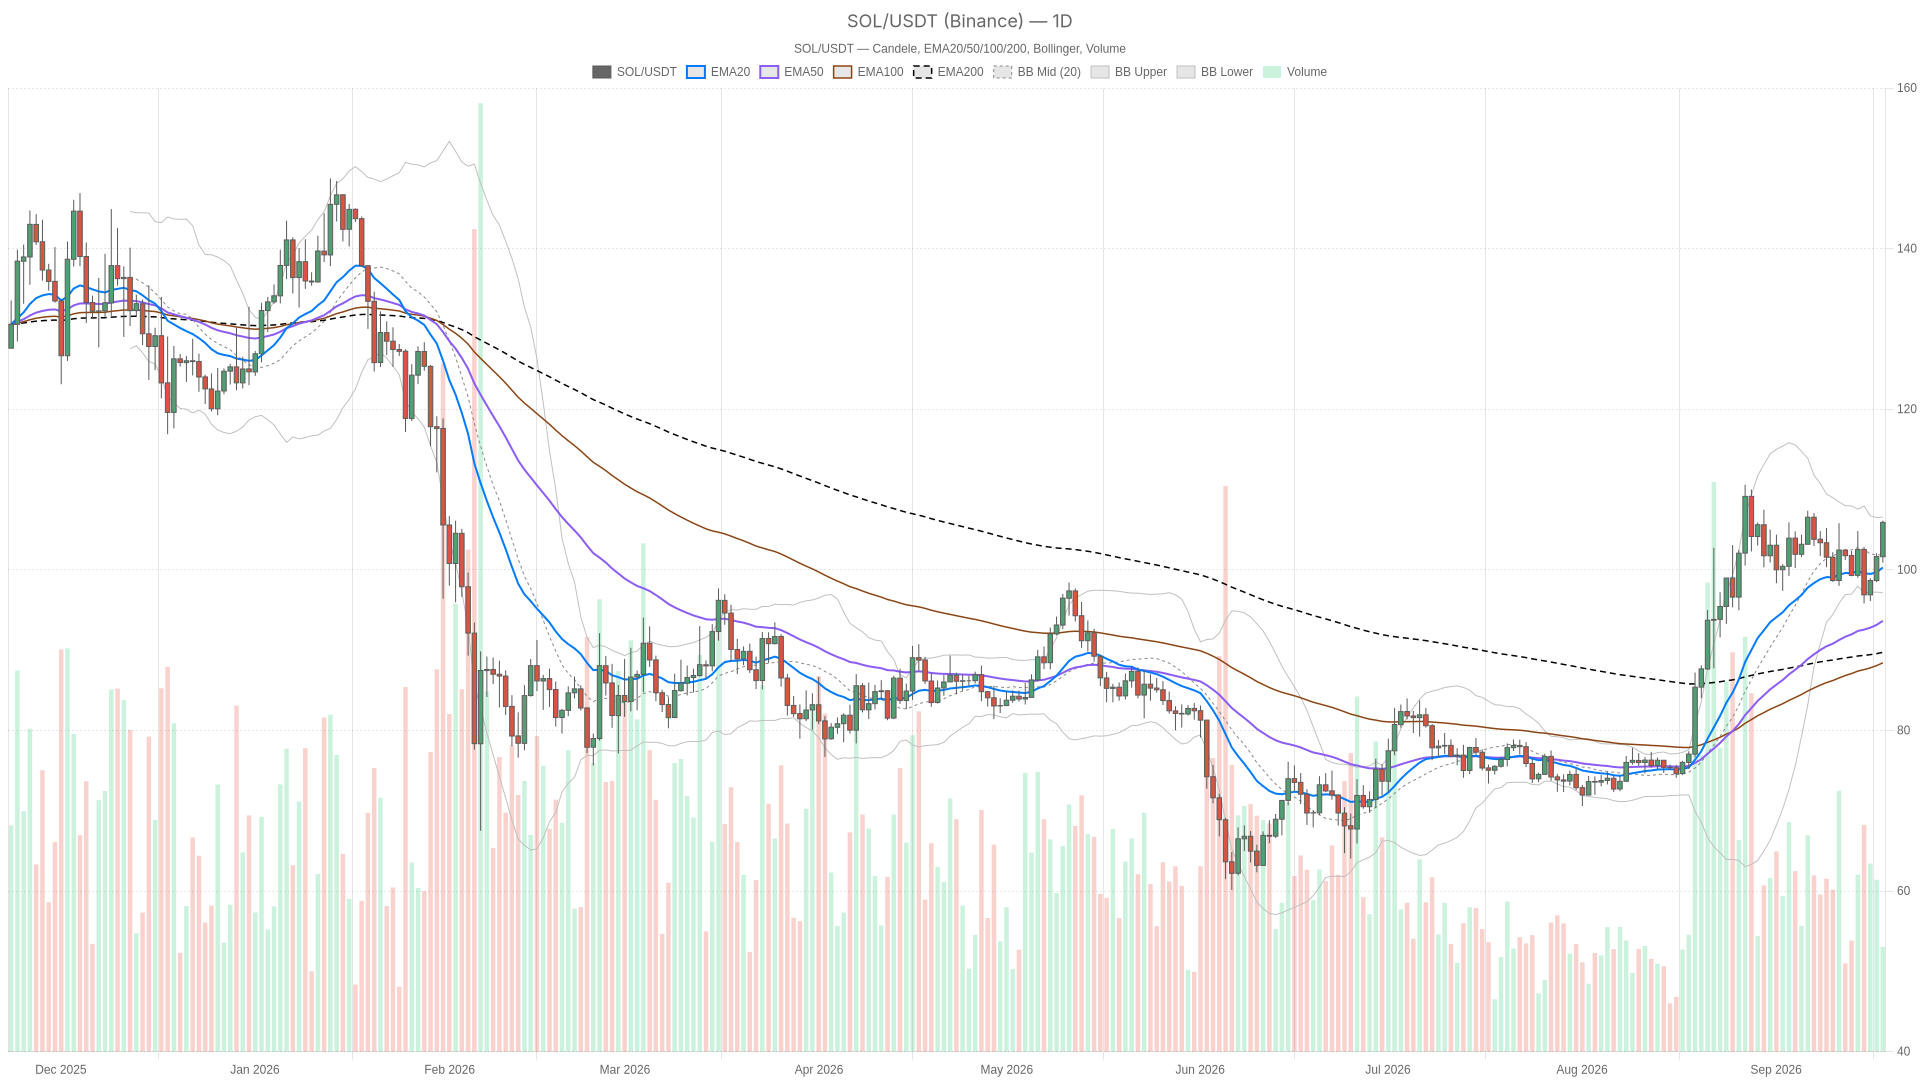
Trading around $105.91 on September 18, 2026, Solana price today finds itself just below the psychological $107-108 resistance zone. The daily structure remains bullish, yet momentum indicators are flashing warnings that the latest push may have gotten ahead of itself.
Key takeaways
- $SOL trades near $105.91 on September 18, 2026, with daily EMAs stacked in a textbook bullish alignment.
- Daily MACD has turned negative (histogram -0.76) while price tests the upper Bollinger Band at $106.56.
- 1H RSI at 80.62 and 15m RSI at 81.79 signal overbought conditions on lower timeframes.
- Raydium AMM fees are up roughly 250% and Orca fees up nearly 60% over 30 days, though daily pullbacks hint at cooling speculative activity.
- Key resistance sits at $107.72 (daily R1); support holds at $102.50 (S1) and $100.28 (EMA20).
Daily chart: bullish trend structure, fading momentum
$SOL’s daily trend remains structurally bullish with the EMA20 (100.28), EMA50 (93.64) and EMA200 (89.72) all stacked in order and sloping higher. However, the MACD histogram at -0.76 reveals a bearish crossover unfolding even as price pushes toward the upper Bollinger Band at 106.56. That divergence between structure and momentum does not invalidate the uptrend, but it signals that the next leg higher may require a consolidation phase first.
Meanwhile, the broader backdrop adds little conviction either way. Total crypto market capitalization hovers near $2.68 trillion, down about 0.6% over 24 hours, while Bitcoin dominance holds at roughly 58%. RSI14 on the daily sits at 60.19, which is elevated but still shy of overbought extremes, and the Fear & Greed Index reads 56 — firmly in Greed territory but far from euphoric extremes.
Short-term charts: overbought signals accumulate
The 1H and 15-minute charts both show RSI readings above 80, confirming that $SOL is overbought on short timeframes. On the hourly, the EMA20 (102.81), EMA50 (101.12) and EMA200 (100.94) all sit below price at 105.92, reinforcing the bullish bias structurally. Yet RSI14 on the 1H sits at 80.62, deep in overbought territory, while the 15-minute MACD histogram has already flattened to -0.02 — suggesting the immediate impulse buying is losing strength.
This multi-timeframe tension defines the current setup. The daily chart argues for patience, while the lower timeframes warn that the move has stretched too far too fast. For intraday traders, the 1H and 15m charts do not offer clean confirmation of the daily trend; instead, they indicate a short-term cooling period is likely, even within the broader uptrend.
Key levels: where support and resistance sit
The daily Bollinger Bands frame the action clearly, with the mid-band at 101.87, the upper band at 106.56, and the lower band at 97.17. Price hugging the upper band reflects strong directional pressure, but it also means limited room before the band itself becomes resistance — particularly with ATR14 at 4.25 pointing to healthy but not extreme daily volatility. Additionally, the daily pivot sits at 104.31, with R1 at 107.72 and S1 at 102.50. A clean break above R1 would be the clearest signal that the daily MACD hesitation is being overridden by fresh buying.
Meanwhile, on the hourly chart, the pivots are far tighter: pivot at 105.79, R1 at 106.12, S1 at 105.58. Combined with an hourly ATR of just 0.86, the market is grinding rather than swinging, which fits the picture of a trend pausing to digest recent gains. On the ecosystem side, Raydium AMM fees are up close to 250% over 30 days and Orca DEX fees have climbed nearly 60% over the same window, signaling genuine onchain activity growth — though PumpSwap and Orca both saw sharp single-day pullbacks, hinting that the most speculative burst may already be cooling.
Bullish scenario
A clean break above the upper Bollinger Band at 106.56 and daily R1 at 107.72 with conviction would confirm the bullish case. The healthiest version of this scenario would see the 1H MACD holding positive while RSI cools from overbought levels through time rather than through a hard price drop — momentum resetting without the trend breaking. This scenario would be invalidated if price fails repeatedly at the 106-108 zone and then loses the daily EMA20 at 100.28, confirming that the bearish daily MACD crossover is doing real damage to the structure.
Bearish scenario
Conversely, the bearish case centers on the daily MACD histogram already negative while RSI on both the 1H and 15m charts sits deep in overbought territory. A rejection at the upper Bollinger Band or daily R1, followed by a slide back through the daily pivot at 104.31 toward S1 at 102.50 or even the EMA20 at 100.28, would fit a standard mean-reversion pullback. That said, this scenario would be invalidated if buyers defend the hourly pivot zone around 105.6-105.8 and push straight back through R1 without surrendering the daily EMA20. In that case, the overbought readings would simply reflect strong trending behavior rather than a genuine warning.
Positioning and risk
Solana price today sits in a genuinely mixed-signal zone: the daily trend is bullish by every structural measure, yet the daily MACD and overbought lower timeframes pull in the opposite direction. That kind of disagreement typically resolves through either a consolidation phase or a sharper-than-expected pullback, and it is rarely wise to assume the outcome in advance. With ATR readings pointing to moderate but real volatility on both timeframes, position sizing and stop placement carry greater weight than usual — this is a moment for respecting that both scenarios remain live until price actually breaks one of the key levels outlined above.
FAQ
What is $SOL’s current price?
As of September 18, 2026, $SOL is trading around $105.91 on the daily chart, sitting just below the upper Bollinger Band and the psychological $107-108 resistance zone.
Is Solana’s daily trend still bullish?
Yes. The EMA20 (100.28), EMA50 (93.64) and EMA200 (89.72) are all stacked in order and sloping higher, forming a textbook bullish EMA regime. However, the daily MACD has produced a bearish crossover with a histogram of -0.76, signaling that momentum is lagging behind price.
What are the key resistance and support levels for $SOL?
Key resistance sits at $106.56 (upper daily Bollinger Band) and $107.72 (daily R1). Support levels to watch are $104.31 (daily pivot), $102.50 (S1), and $100.28 (daily EMA20). A break of any of these levels would clarify the short-term direction.
Disclaimer: This article is for informational purposes only and does not constitute financial advice, an investment recommendation, or a solicitation to buy or sell any financial instrument or cryptocurrency. The analysis provided is not indicative of future results. Investing in crypto assets and financial markets carries a high risk of capital loss. Always do your own research (DYOR) and consult a qualified financial advisor before making any decision.
Article produced with the assistance of artificial intelligence and reviewed by the editorial team.

 u.today
 coinpedia.org
 cryptoslate.com
