
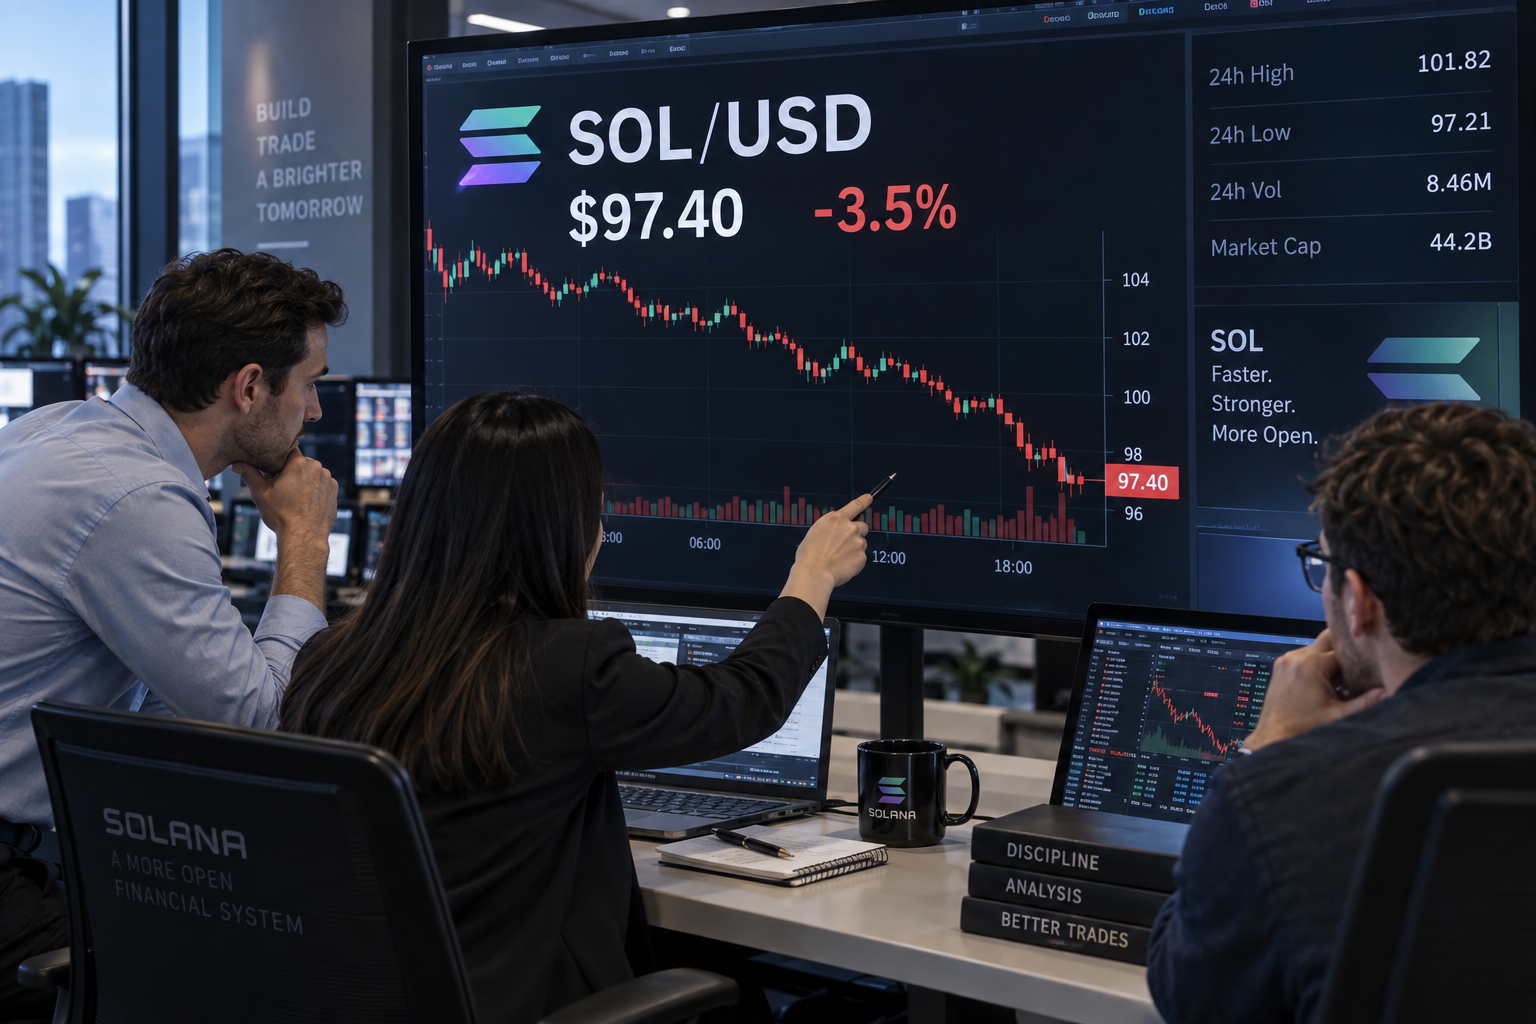

Solana activated its Transaction V1 format on the mainnet on September 15, increasing the network’s maximum transaction size from 1,232 bytes to 4,096 bytes.
The upgrade enables developers to build more complex and>Transaction V1 raises Solana’s limit to 4,096 Bytes
Solana’s new Transaction V1 format more than triples the maximum amount of data that can be included in a single transaction.
The previous 1,232-byte limit restricted the number of instructions, signatures, and other data developers could package together. Increasing the maximum size to 4,096 bytes allows applications to execute more complex operations without dividing them across multiple transactions.
The additional capacity could support privacy applications using zero-knowledge proofs, sophisticated DeFi transactions and multisignature arrangements involving more participants.
While the upgrade broadens Solana’s technical capabilities, it did not produce an immediate positive reaction in $SOL’s price.
$SOL trades below short-term moving averages
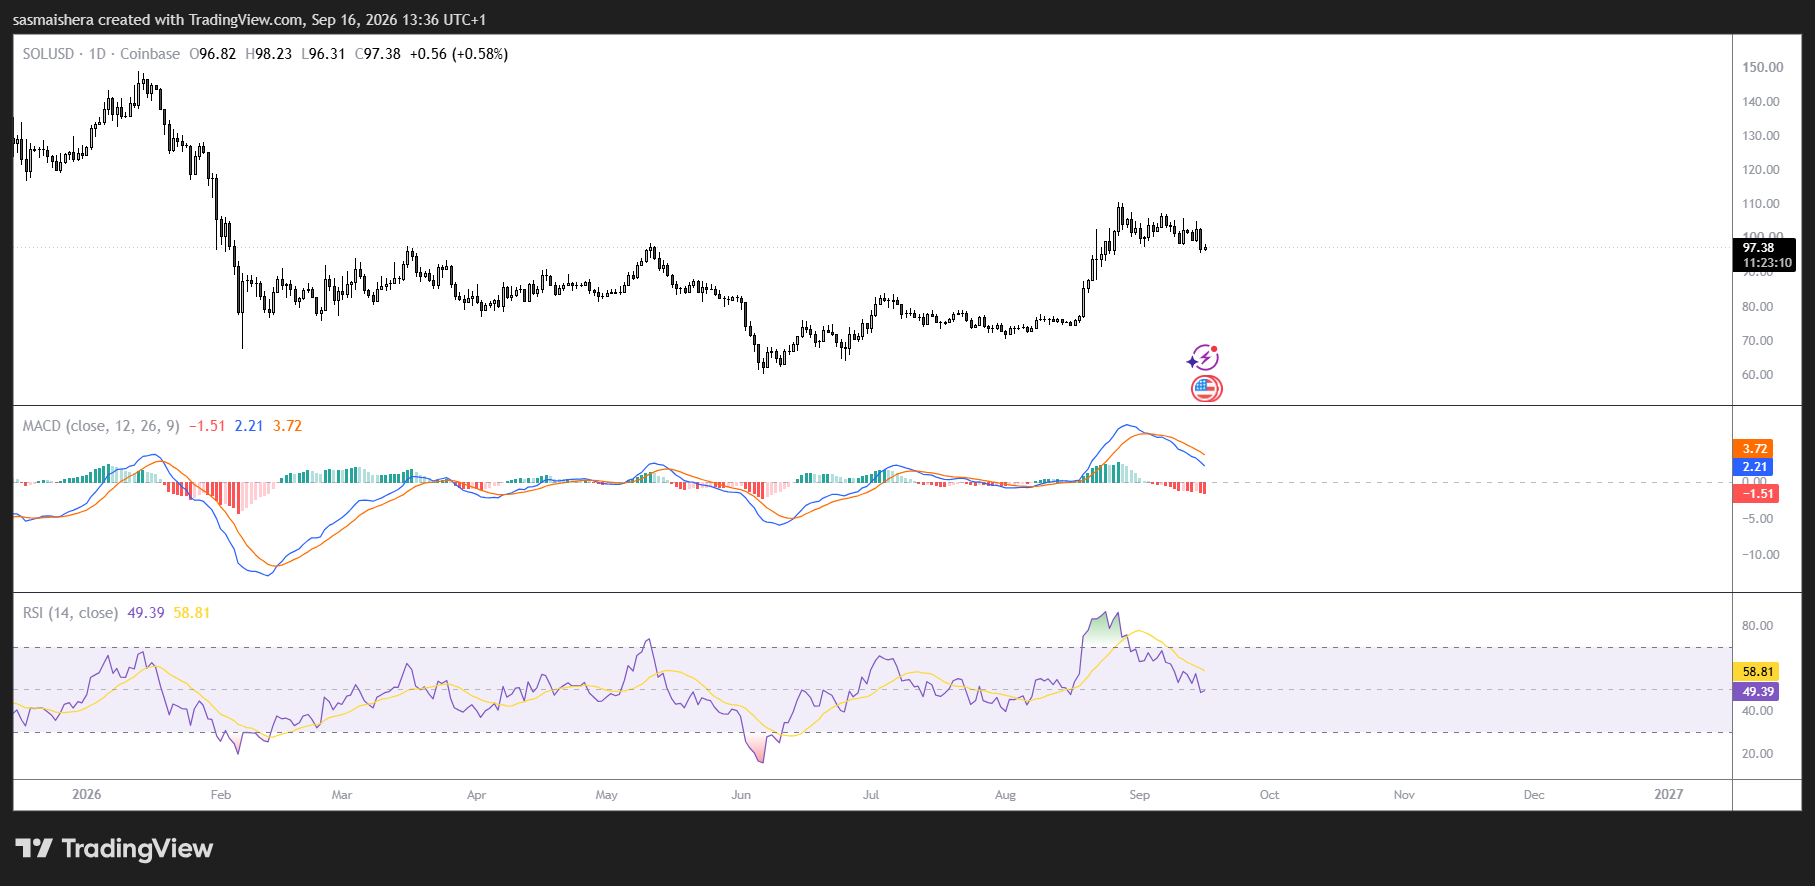
Solana is trading below its 20-period and 50-period moving averages on the hourly chart, signaling continued weakness across intraday and short-term timeframes.
However, $SOL remains above its 200-day moving average. Holding above this longer-term indicator preserves the broader market structure despite the current correction.
Immediate resistance sits close to the $98.77 level. $SOL must reclaim this level to strengthen the case for a short-term recovery.
A higher resistance level stands at approximately $99.42, which marks the upper boundary of the projected consolidation range.
Several momentum indicators continue to produce bearish signals. The Moving Average Convergence Divergence indicator shows a strong sell signal, while the Average Directional Index supports the negative momentum outlook.
Bull/Bear Power also indicates that sellers remain in control. The Awesome Oscillator, however, provides no decisive directional signal.
Meanwhile, the Relative Strength Index and Stochastic RSI have moved into the negative territory on the daily chart. These readings reflect intense selling pressure but also raise the possibility of a temporary relief bounce if buyers return near support.
Short-term scenario analysis expects $SOL to trade between $94.16 and $99.42. The forecast assigns a 76% probability to further downward movement and a 24% probability to a rebound.
These probabilities represent one analytical model rather than guaranteed outcomes. A sustained break above $98.77 could improve momentum and allow $SOL to challenge the upper boundary at $99.42.
Conversely, failure to defend $94.16 would confirm additional weakness and could accelerate the decline as stop-loss orders and leveraged liquidations enter the market.
Analysts are confident that the Transaction V1 is an important foundation for Solana’s future adoption, even though its immediate effect on market sentiment has been limited.
The upgrade expands what developers can build on the network and could support more demanding applications over time.
However, technical improvements do not necessarily translate into immediate token-price appreciation.
For now, $SOL’s outlook remains divided between improving network fundamentals and bearish short-term price momentum.

 coinpedia.org
 ambcrypto.com
 coinedition.com