

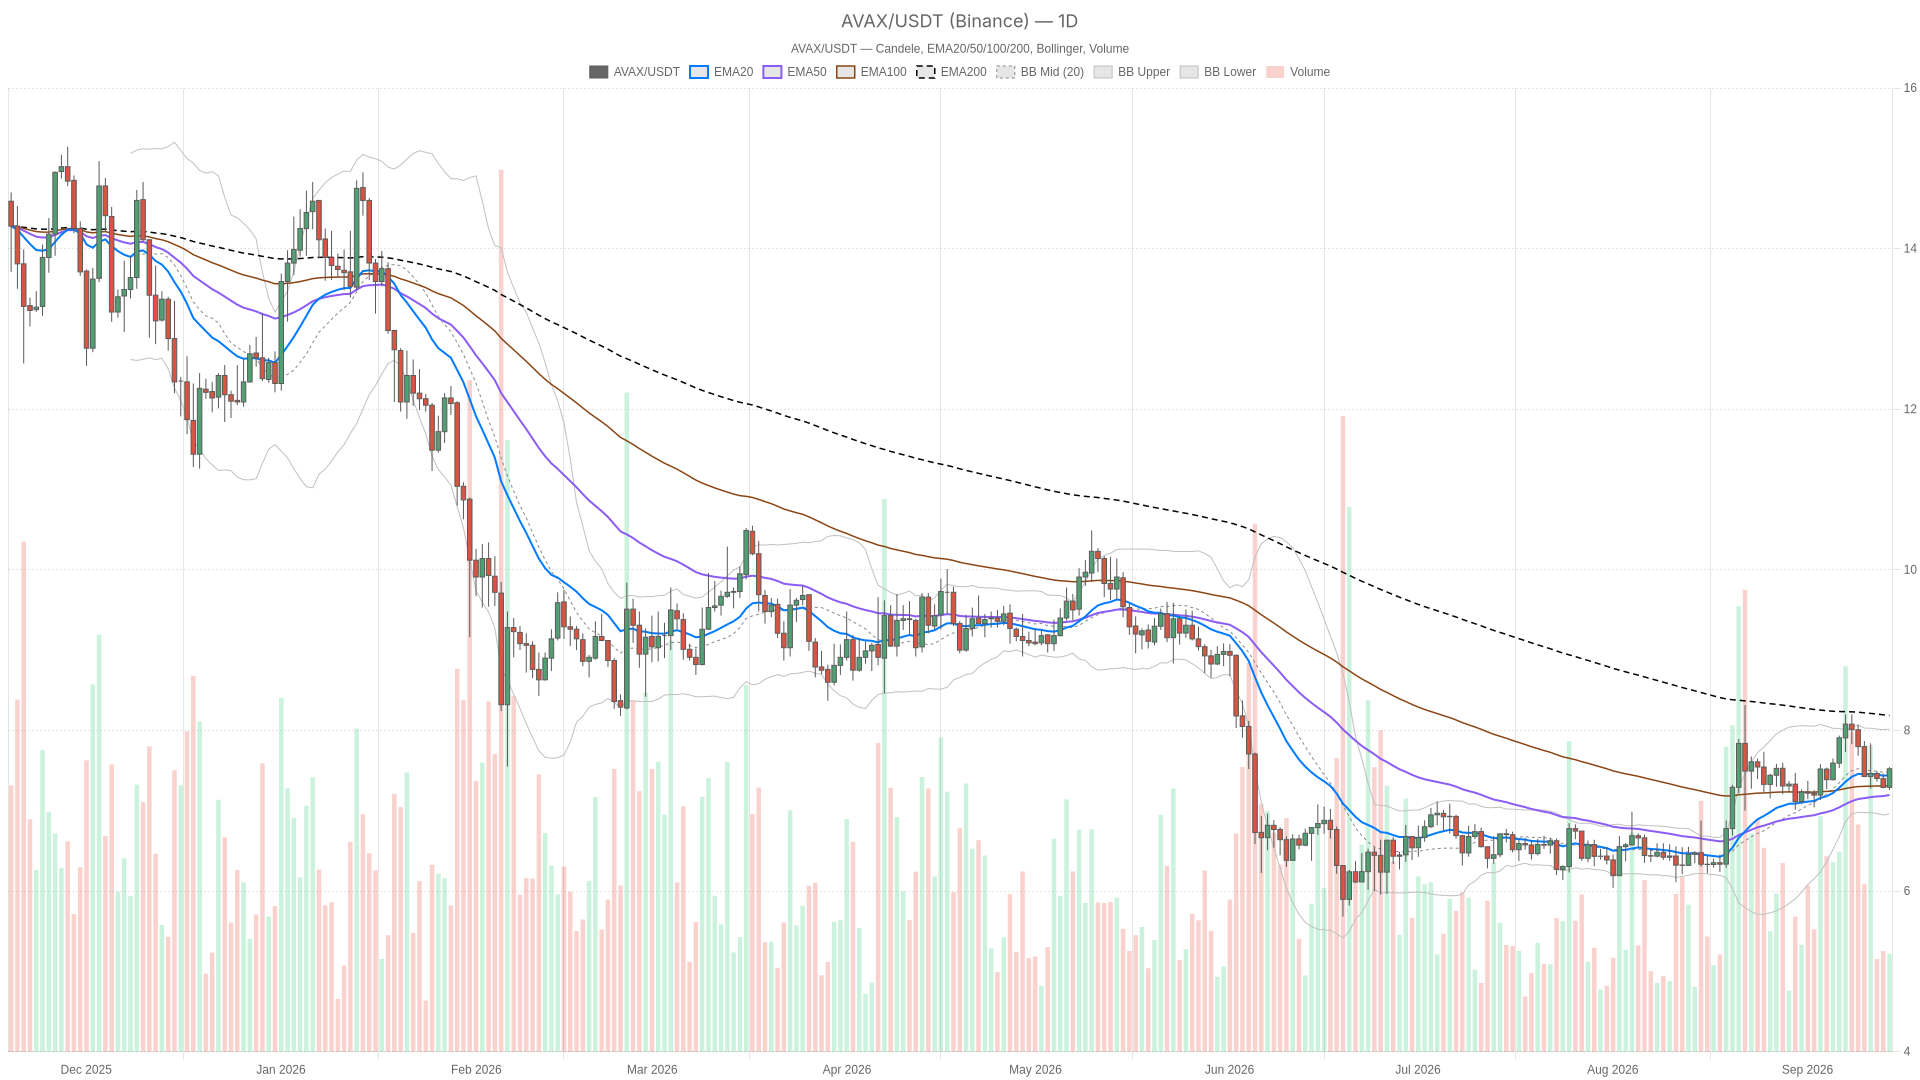
As of September 14, 2026, the price of Avalanche crypto sits at $7.52, caught between a short-term recovery and a longer-term downtrend. The token has reclaimed its daily 20 and 50 EMAs but remains well below the 200 EMA at $8.19, keeping the broader structural picture unresolved.
Key takeaways
- $AVAX trades at $7.52 on September 14, 2026, above its daily 20 and 50 EMAs but below the 200 EMA at $8.19
- Daily MACD histogram remains negative at -0.06, signaling momentum is decelerating despite the price recovery
- On-chain DEX fees surge across Avalanche: Joe V2.2 up 208%, Pharaoh V3 up 125%, Blackhole CLMM up 94% in 24 hours
- Bitcoin dominance near 58.6% and a flat $2.70 trillion market cap weigh on altcoin upside potential
- Hourly chart shows tight compression between $7.48 and $7.55, pointing to an imminent volatility expansion
Avalanche Crypto Daily Structure: Recovering, But Not Yet Trending
On the daily chart, $AVAX closing at $7.52 above its 20 EMA at $7.44 and 50 EMA at $7.20 is a real short-term positive. It shows buyers have reclaimed ground lost in the prior downswing. However, the 200 EMA at $8.19 is the elephant in the room. Until price closes convincingly above that level, this remains a bounce inside a larger downtrend, not a trend reversal. The daily RSI at 53.7 backs that read — neutral and slightly tilted bullish, but nowhere near signaling strong directional conviction either way.
The MACD is where the daily chart turns genuinely mixed. The line sits at 0.13, below the signal at 0.19, leaving a negative histogram of -0.06. That represents a subtle but real divergence: momentum is decelerating even as spot price holds steady. It does not scream reversal, but it suggests the recovery may be losing steam. Bollinger Bands frame this clearly — with price at $7.52 hugging the midline at $7.49, $AVAX sits between the lower band at $6.96 and the upper band at $8.02, right in the middle of its recent volatility range.
Daily ATR at 0.33 confirms this is a market moving with moderate, not extreme, volatility. The daily pivot at $7.44 with resistance at $7.62 and support at $7.34 puts price just above pivot — a spot where bulls hold a slight edge but nothing decisive yet.
1H Timeframe: Short-Term Strength Meeting Resistance
Zooming into the 1-hour chart, the picture tilts more bullish, at least for now. Price at $7.52 sits essentially glued to a tightly compressed EMA cluster — 20 EMA at $7.43, 50 EMA at $7.42, and 200 EMA at $7.54. This usually signals a market coiling before a decisive move rather than one already trending cleanly. RSI at 64.87 is running hot, approaching overbought territory, and the MACD histogram has flipped slightly positive at +0.01 with the line just above the signal.
That is short-term bullish, but it reads more like a market pressing into resistance than breaking free of it. The Bollinger Band setup reinforces that idea: with the upper band at $7.52 essentially equal to the current close, price is pressing directly against the top of its short-term range. The hourly pivot at $7.50, with resistance at $7.55 and support at $7.48, shows $AVAX trading inside a compressed zone where the next real move often gets decided.
15-Minute Context: Bullish Label, But Momentum Is Flattening
The 15-minute regime is tagged outright bullish, and RSI at 61.81 supports that near-term lean. However, look closer at the MACD — line and signal are both sitting at 0.02, with a histogram of essentially zero. That is a market that just pushed higher but is now running out of fresh momentum right at resistance. This timeframe is useful purely for execution: it tells intraday traders that the immediate push has stalled just under the $7.52 ceiling.
Put the three timeframes together and there is a genuine tension worth naming directly: the daily chart is neutral-to-cautious with fading momentum, the hourly chart is stretched into resistance, and the 15-minute chart shows that stretch already losing steam. None of these timeframes scream for a breakout — they describe a market pausing at a decision point.
An Underappreciated Signal: On-Chain Activity Diverging From Price
What makes this moment more interesting is what is happening beneath the price chart. Fee data from Avalanche-native decentralized exchanges shows a sharp pickup in on-chain activity. Joe V2.2 fees jumped 208.29% in a single day and 173.91% over seven days. Pharaoh V3 posted a 125.68% one-day gain and a 203.9% increase over 30 days. Blackhole CLMM saw a 94.06% one-day fee spike and 87.35% growth over 30 days.
That is a meaningful surge in trading and liquidity activity across the Avalanche ecosystem‘s DEX layer, and it is happening while $AVAX itself is still consolidating below its 200-day EMA. This divergence cuts both ways. It could mean usage is quietly building ahead of price — a pattern where on-chain activity leads token performance by weeks. Or it could simply reflect volatile, short-lived fee spikes that do not translate into sustained demand for the token itself.
Bullish Scenario for $AVAX
For bulls, the case builds if price holds above the daily pivot at $7.44 and clears hourly resistance at $7.55. That would open a path toward the daily R1 at $7.62 and eventually the upper Bollinger Band at $8.02. A daily close above the 200 EMA at $8.19 would be the real confirmation that this stops being a bounce and becomes an actual trend change. For that to happen, the daily MACD histogram needs to flip positive again — right now it is still negative, which is the main factor holding the bullish case back.
This scenario is invalidated if price loses the $7.44 pivot and slips back through the tightly packed hourly EMA cluster around $7.42–7.43. That would signal the recovery attempt failed to gain traction and sellers are back in control of the short-term tape.
Bearish Scenario for $AVAX
The bearish case leans on the fact that $AVAX remains structurally below its daily 200 EMA at $8.19, and the daily MACD histogram is still negative even as price recovered. A rejection at hourly resistance near $7.54–7.55 — which lines up with both the hourly 200 EMA and pivot resistance — could send price back toward the daily EMA20 at $7.44 or the daily S1 support at $7.34. A deeper move would target the lower Bollinger Band around $6.96, especially if the daily 50 EMA at $7.20 fails to hold as support along the way.
This bearish read gets invalidated if daily momentum turns — specifically if the MACD histogram flips positive and price closes decisively above the $7.62 resistance level. That would show buyers can absorb selling pressure into the 200 EMA zone rather than stalling below it.
Where This Leaves Traders
Right now, Avalanche crypto sits in a genuinely undecided spot — not the kind of setup that rewards conviction in either direction. The daily chart shows recovery without confirmed trend change, the hourly chart shows strength running into resistance, and the 15-minute chart shows that strength already cooling off. Bitcoin dominance remains elevated near 58.6%, and with total market capitalization essentially flat, $AVAX does not have a strong macro tailwind doing the work for it either.
The DEX fee surge across the Avalanche ecosystem adds a layer of intrigue, but it has not yet translated into a decisive price move, and there is no guarantee it will. Given the daily ATR of 0.33 and the tight compression visible on the hourly chart, volatility could expand quickly in either direction once the current range resolves. This is a moment to respect the uncertainty rather than pick a side prematurely — watch how price behaves around the $7.44–7.62 zone on the daily and the $7.48–7.55 pocket on the hourly, since that is realistically where the next directional signal will come from.
FAQ
Is $AVAX in a bullish or bearish trend right now?
Avalanche holds a neutral-to-cautious position. It trades above its daily 20 and 50 EMAs but remains below the 200 EMA at $8.19, meaning the recovery is not yet confirmed as a trend change. The daily MACD histogram stays negative at -0.06, suggesting momentum has not turned decisively bullish.
What is the most important resistance level for $AVAX?
The critical level is the daily 200 EMA at $8.19. On the hourly chart, resistance sits at $7.55, which aligns with both the hourly 200 EMA and the pivot zone. A daily close above $8.19 would be the first real signal of a trend reversal.
Why are DEX fees surging on Avalanche while price remains flat?
The divergence may signal that network usage is quietly building ahead of price — a pattern where on-chain activity leads token performance by weeks. However, it could also reflect volatile, short-lived fee spikes that do not translate into sustained demand for the $AVAX token itself. Either way, it is a data point worth monitoring alongside the technical setup.
What would confirm a bullish trend reversal for $AVAX?
A daily close above the 200 EMA at $8.19, combined with the daily MACD histogram flipping positive, would confirm a genuine trend change rather than a bounce inside a downtrend. Until both conditions are met, the recovery remains unconfirmed and the structural risk stays tilted to the downside.
Disclaimer: This article is for informational purposes only and does not constitute financial advice, an investment recommendation, or a solicitation to buy or sell any financial instrument or cryptocurrency. The analysis provided is not indicative of future results. Investing in crypto assets and financial markets carries a high risk of capital loss. Always do your own research (DYOR) and consult a qualified financial advisor before making any decision.
Article produced with the assistance of artificial intelligence and reviewed by the editorial team.

 ambcrypto.com
 coinfomania.com