


Zcash price remains under pressure after retreating from its multi-year high, with technical and liquidation data pointing to $1,100 as the key level determining its next move.
According to data from crypto.news, Zcash ($ZEC) price traded near $1,139 on Sep. 14 as buyers attempted to stabilize the privacy-focused token following a steep correction from its recent peak.
$ZEC climbed as high as $1,162 during the latest daily session after opening at $1,062, according to the Binance chart. Despite the intraday recovery, the token remained around 12% below its multi-year high near $1,290.
The wider trend remains positive after Zcash rallied from approximately $500 in mid-August. However, its failure to extend the advance above $1,290 and the subsequent swings between $1,050 and $1,200 point to increased profit-taking.
Why is Zcash price under pressure?
Zcash’s pullback followed a derivatives market reset after leveraged traders added exposure during the token’s rapid rally.
$ZEC futures open interest reportedly dropped by around 20% over 24 hours, while approximately $17.2 million in long positions were liquidated. Forced closures added selling pressure as the token fell from its recent high.
The leverage flush followed increased attention around Grayscale’s Zcash Trust, which began trading as a publicly listed product on NYSE Arca. Demand surrounding the product supported $ZEC’s earlier advance, but the fast price increase also left the market exposed to profit-taking and liquidations.
Broader risk sentiment added pressure. Rising tensions in the Middle East and oil prices approaching $100 per barrel raised inflation concerns, while hotter-than-expected U.S. consumer price data affected expectations for monetary policy.
Prediction markets placed the probability of a 25-basis-point Federal Reserve rate increase at about 86% ahead of the Sep. 16 meeting. The U.S. 10-year Treasury yield also reportedly reached 4.81%, making higher-risk assets less attractive to some investors.
Zcash also faces uncertainty surrounding a reported code vulnerability identified with artificial intelligence tools. Confirmation from the project’s developers or an independent security audit would be needed to determine the severity of any potential flaw.
The concern comes as the Zcash ecosystem considers longer-term changes, including quantum-resistant cryptography and a potential transition from proof-of-work to proof-of-stake. Traders may continue monitoring whether development teams provide further details about the reported security issue.
Zcash price technical analysis
The daily chart shows that $ZEC has entered a cooling period after touching the upper Bollinger Band during its latest rally.
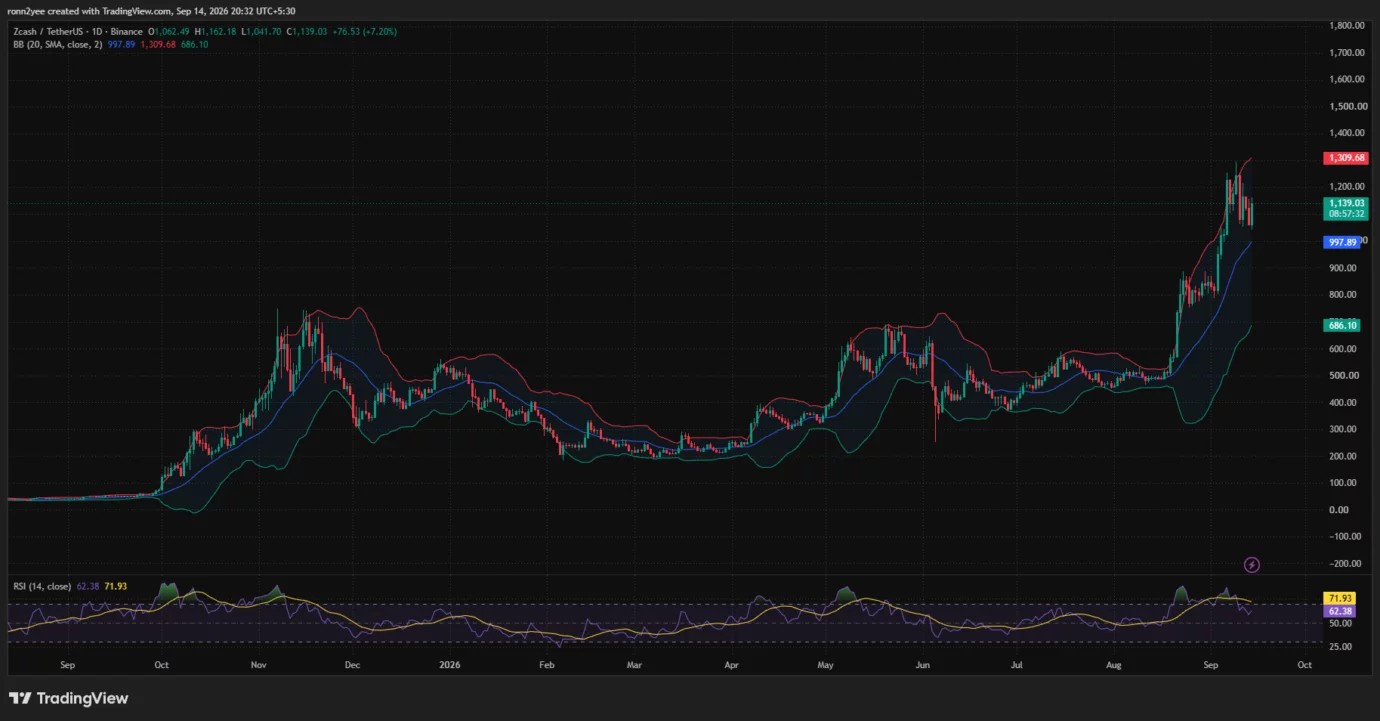
Zcash traded at $1,139 at the time of the chart, while the upper Bollinger Band stood at $1,309.68. The gap leaves room for another advance, but the recent rejection near $1,290 shows that sellers remain active below the upper boundary.
The 20-day simple moving average, which forms the middle Bollinger Band, was at $997.89. $ZEC remains well above the moving average, meaning the broader daily structure has not yet turned bearish.
A retracement toward the middle band would bring the token close to the psychological $1,000 level. The lower Bollinger Band stood at $686.10, reflecting the unusually wide trading range created by the recent price expansion.
The daily relative strength index was 62.38, below its moving average at 71.93. RSI has moved out of overbought territory, showing that buying pressure has weakened since the latest peak.
However, an RSI reading above 50 still favors buyers over a longer time frame. A drop below the neutral level would provide stronger evidence that the correction is developing into a broader trend reversal.
The 4-hour chart presents a more balanced setup. $ZEC traded above Supertrend support at $1,123.31 but remained below Supertrend resistance at $1,206.23.
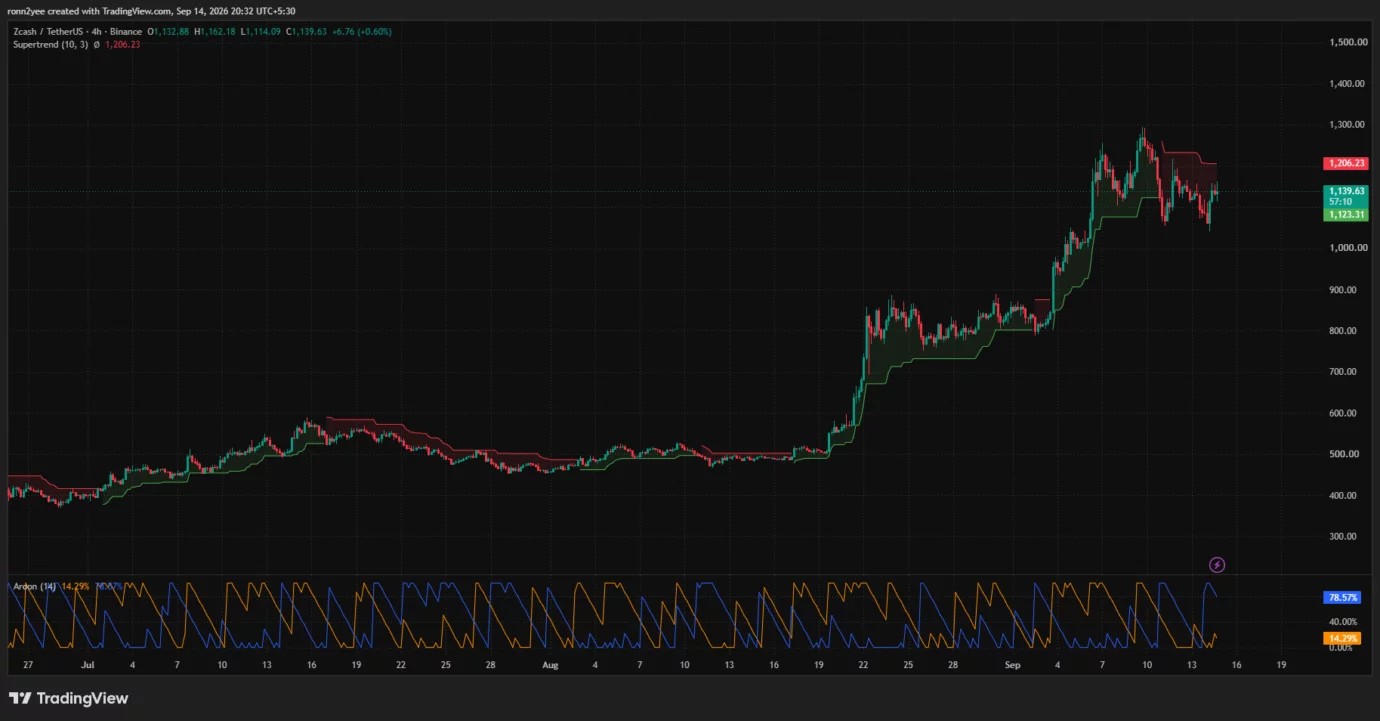
Price must reclaim $1,206 to restore stronger short-term bullish momentum. A successful breakout could send $ZEC toward $1,250 before buyers challenge the recent peak between $1,290 and $1,310.
Aroon readings also favor the broader uptrend. Aroon Up stood at 78.57%, compared with an Aroon Down reading of 14.29%, showing that recent highs remain more influential than recent lows.
The low Aroon Down reading suggests sellers have not established a sustained bearish trend. However, $ZEC’s position below the Supertrend resistance means buyers still need confirmation before another advance.
Can $ZEC hold the $1,100 support?
CoinGlass’ 24-hour liquidation heatmap shows a large concentration of leveraged positions near $1,110. The cluster sits just below the current price and could attract $ZEC if selling pressure returns.
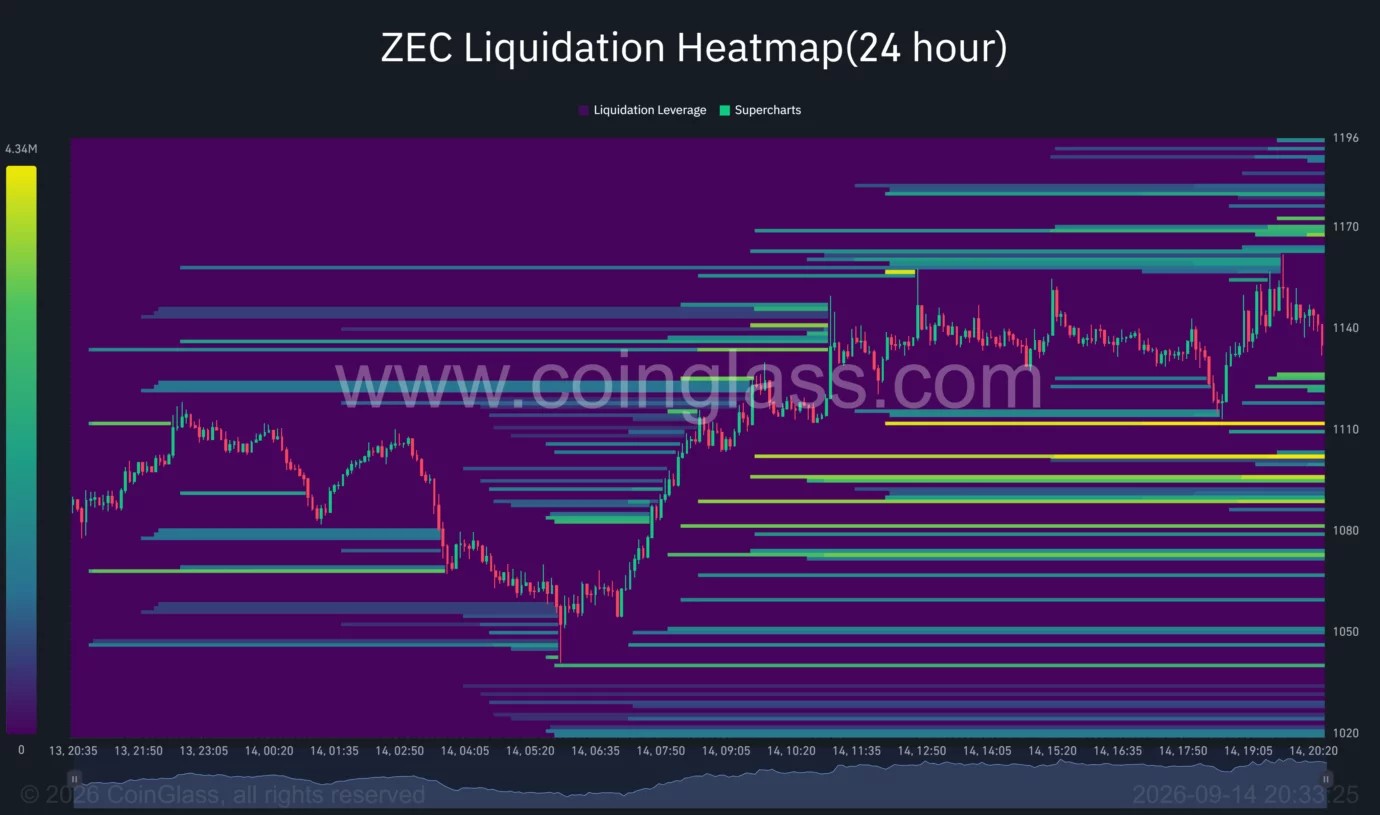
Further liquidity appears around $1,095 and between $1,080 and $1,090. A break below $1,100 could therefore cause another round of long liquidations and send the token toward the daily middle Bollinger Band near $998.
On the upside, liquidation clusters appear between $1,165 and $1,175. A move through the area could liquidate short positions and help $ZEC approach the $1,206 Supertrend resistance.
Crypto trader Woods said $ZEC swept a previous demand level during the weekend before rebounding. The trader remained interested in the pair but expected possible retests around the Federal Reserve meeting.
Altcoin Sherpa identified the area around $1,000 as a possible consolidation zone. The trader said $ZEC could trade around that level before another advance if Bitcoin remains stable, while a strong Bitcoin breakout could send $ZEC toward $1,500.
Zcash must hold the $1,100–$1,123 zone to maintain its short-term recovery. A close below the range would expose $1,050 and $1,000, while a recovery above $1,206 could shift attention back to $1,290 and the upper Bollinger Band near $1,310.

 coinedition.com
 en.cryptonomist.ch
 invezz.com