


 1
1
The total crypto market cap fell by 1.91% in the last 24 hours, from $2.66 trillion to $2.61 trillion. Bitcoin [$BTC], for its part, fell 2.1% in 24 hours, continuing its slide that began last Friday. In fact, $BTC faced rejection at $81.3K, bringing its weekly losses to 5.4%.
Reacting to these losses, Chainlink [$LINK] also lost 3.66% of its value. Starting on 2nd September, $LINK had rallied by 25.46% to climb from $10.9 to $13.68 in just under a week.
However, it was trading at $11.48 at the time of writing, a deep retracement of the rally earlier this month. Even so, its price structure remained bullish. What can $LINK traders and investors expect next?
Accumulation and retained activity give Chainlink bulls hope
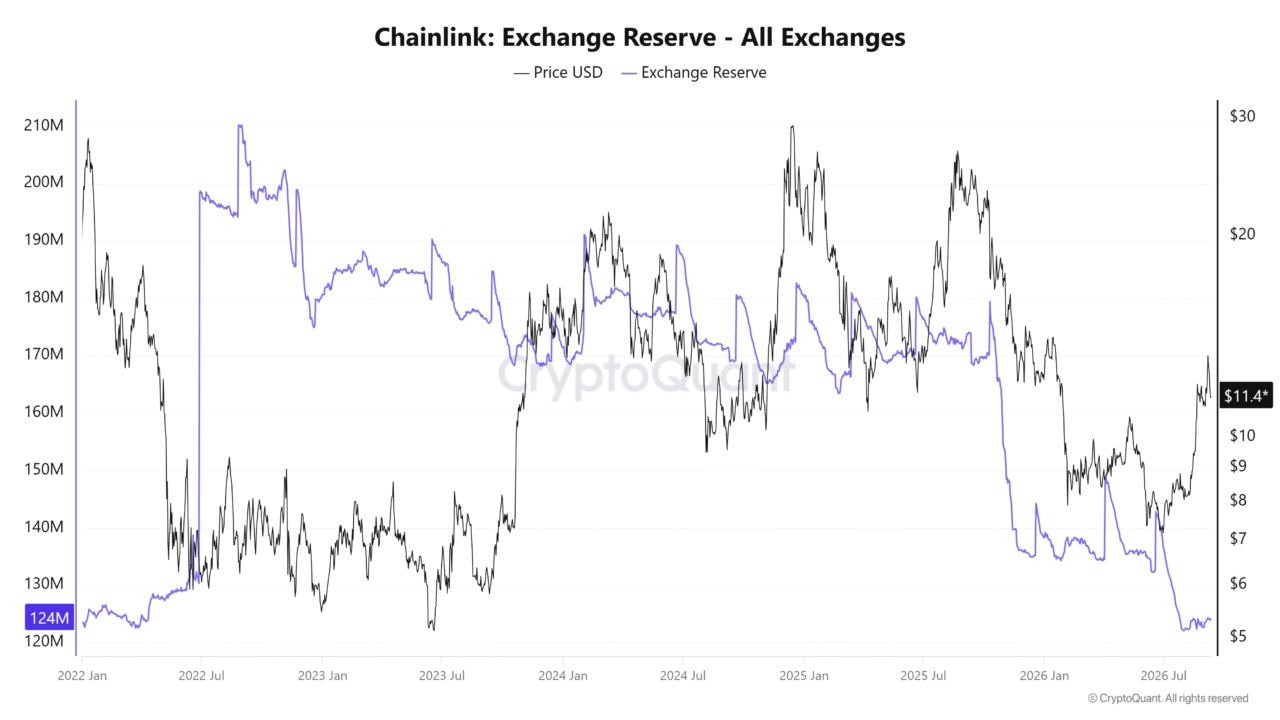
$LINK’s exchange reserve was at its lowest since mid-2022. The steady decline over the past year indicated accumulation trends and investor anticipation of a recovery.
This longer-term holding behavior has been accompanied by greater trading volume over the past six weeks, when the altcoin began to make its recovery from $7. CryptoQuant data showed that the Futures taker CVD was buy-dominated until 8th September, confirming recent aggressive demand.
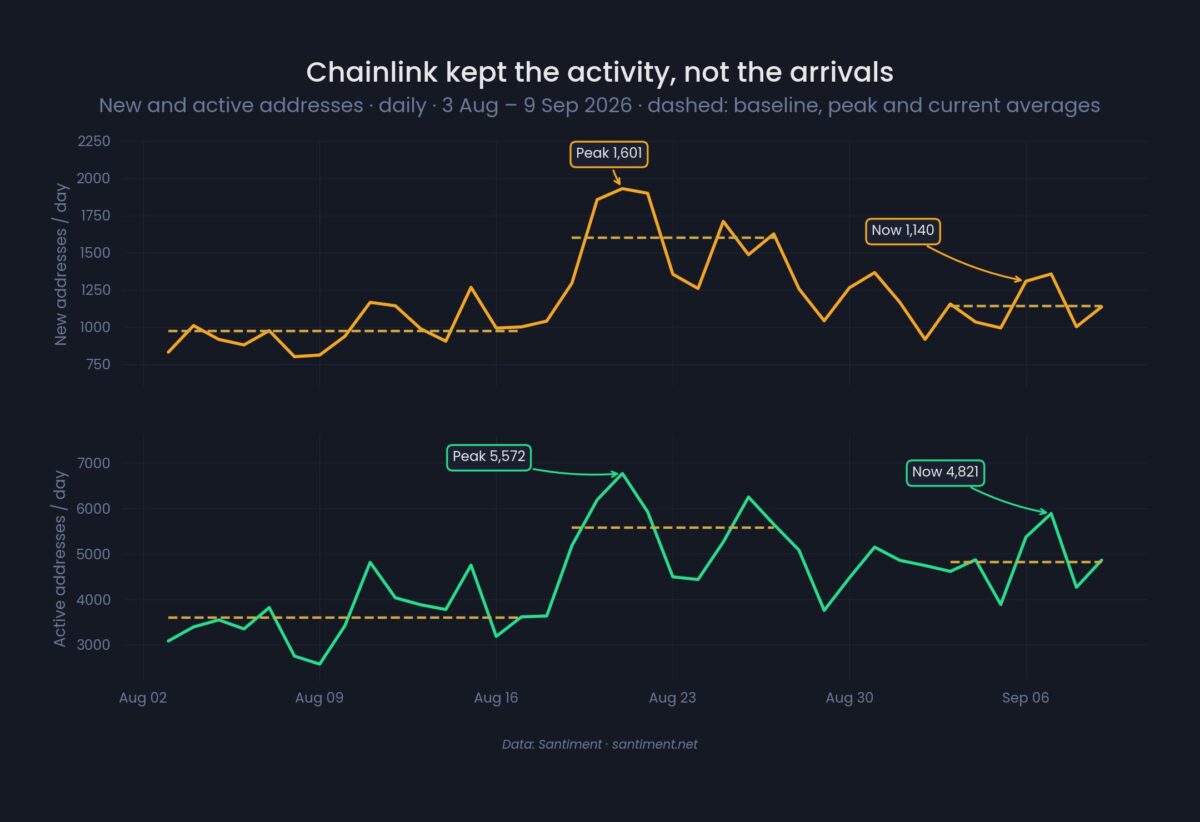
In a post on X, crypto intelligence platform Santiment observed that active addresses peaked at 5,572 a day in August. However, they have fallen to around 4,821 since.
New addresses peaked at 1,601, with the same around 1,140 at press time. About two-thirds of the activity uptick has been retained, and a quarter of the new addresses surge has held.
Sustained activity would be a good sign of users returning to the market and would be a good sign of demand and Chainlink’s recovery.
What does Chainlink’s price action reveal?
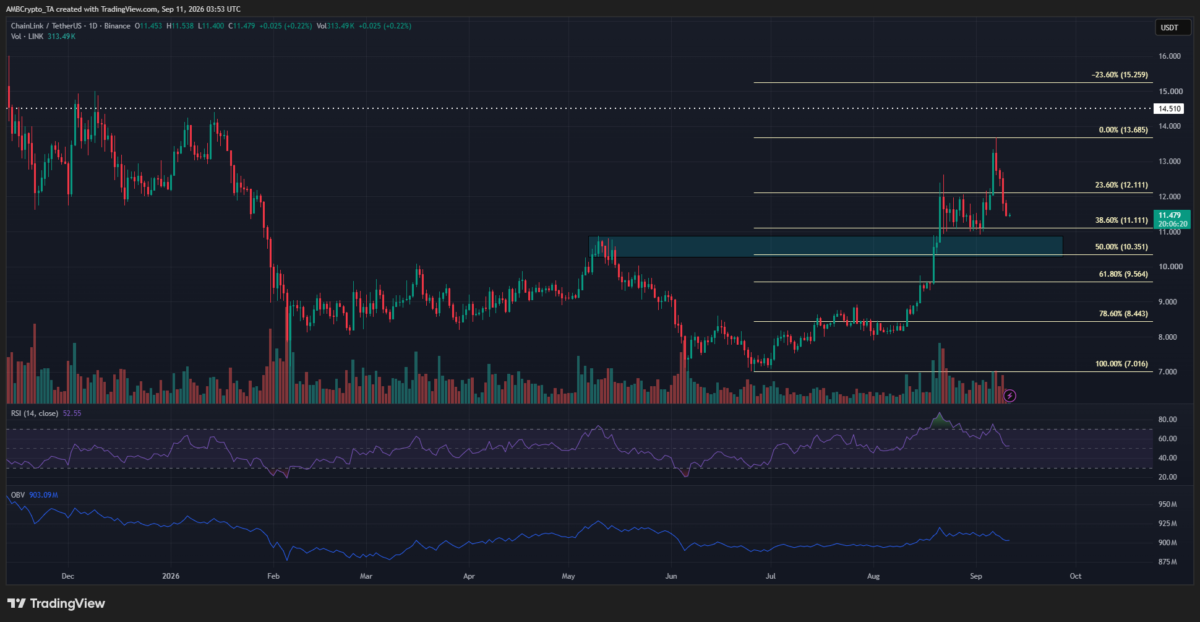
The daily timeframe revealed a bullish swing structure now that the previous swing high at $10.87 was comfortably breached. The descent below the short-term support at $12.11 meant a move to $10.35, and possibly as deep as the 78.6% Fibonacci retracement level at $8.44.
The RSI returned to neutral 50 to reflect the momentum shift in recent days. The OBV saw a minor decline since the late-August peak, but its uptrend since July remained intact.
Investors can maintain a long-term bullish bias, but might also need to prepare for a pullback to $10.35 or $8.44.
Final Summary
- Chainlink exchange reserves fell to a 4-year low, showing accumulation was steady and ongoing.
- Aggressive derivatives demand and heightened on-chain activity marked the recent rally.


