



 2
2
The recent relief bounce from $XRP may not have ended the current pullback, as its Elliott Wave structure calls for one more dip.
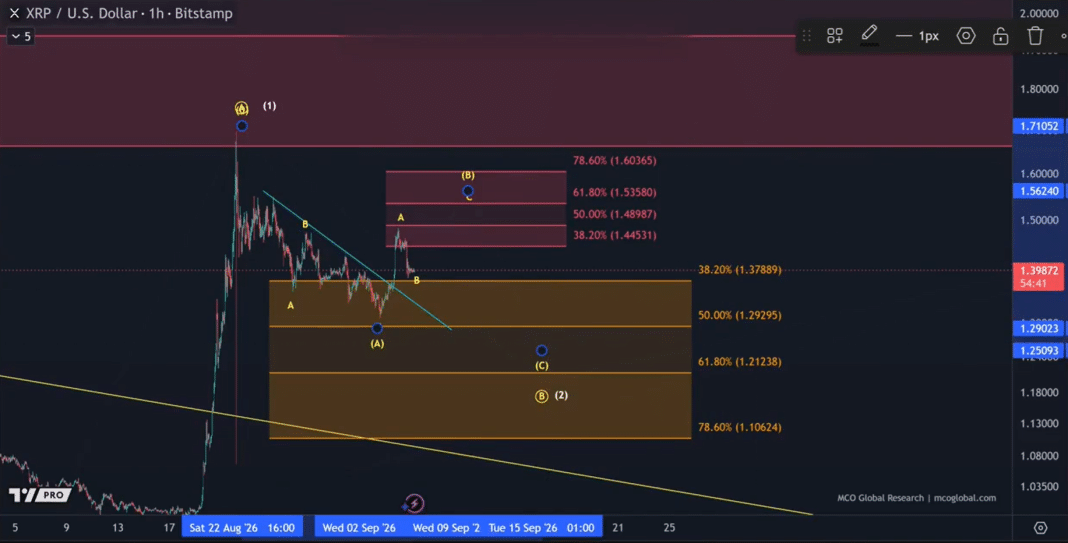
Notably, the Elliott Wave theory on the 1-hour chart shows that the latest bounce has not yet formed the structure needed to confirm a lasting bottom. This suggests there is room for another drop into the support zone before $XRP can begin a recovery.
$XRP’s August Rally
The current structure started with $XRP’s recovery from $0.99 in early August 2026. The price rose from around $0.99 on Aug. 11 to $1.70 by Aug. 22. This move gave the token a 28.5% gain for August, marking its strongest monthly performance for the month since 2021.
The hourly chart shows several features of an impulsive Elliott Wave move. Specifically, price climbed quickly and moved in a defined direction, which often indicates Wave 1 in a larger bullish sequence.
If this holds, $XRP could have more room to surge after completing its current correction. $XRP has also shown a pattern of sudden rallies followed by longer periods of consolidation, and the current structure follows a similar path.
After reaching $1.70, $XRP started dropping through overlapping price action instead of following a clear, impulsive decline. This pattern suggests that the market is trying to stabilize, not necessarily entering a fresh major downtrend.
The chart places the main support zone between $1.10 and $1.38. Importantly, four important Fibonacci retracement levels sit within this area at $1.38, $1.29, $1.21, and $1.10. At press time, $XRP trades around $1.39, which puts it near the upper edge of this demand zone.
Why Three Waves Is Not Enough
$XRP has started bouncing from its recent low, and the move may initially look like confirmation that the correction has ended.
However, the current upward push contains only three waves. Elliott Wave theory generally requires a five-wave upward structure to confirm that a correction has ended and that buyers have regained control.
For now, the move fits better as a B wave within a larger A-B-C correction. Under this view, Wave A took $XRP from the $1.70 high down into the support zone, while the current bounce represents Wave B.
This leaves room for a potential Wave C decline before a sustained recovery begins. However, it is important to note that Wave B could still climb higher before sellers return.
The chart places resistance between $1.44 and $1.60, with Fibonacci levels at $1.44, $1.49, $1.53, and $1.60. If sellers take control in that area, Wave C would become stronger, with $1.21 and potentially $1.10 coming up as downside targets.
What Macro Catalysts Could Influence the Picture
Meanwhile, the Elliott Wave structure is only one part of the setup. Notably, other market and regulatory developments could also affect $XRP’s next move.
For one, US spot $XRP ETFs recorded $18.96 million in fresh inflows over the past week, taking cumulative ETF inflows to $1.68 billion. The continued inflows show that institutional demand remains active around current price levels.
$XRP also trades above its 20-day, 50-day, 100-day, and 200-day exponential moving averages. This has helped push the short-term trend from bearish to bullish and confirms that the broader bullish structure remains intact, even if $XRP experiences another short-term decline.
For now, $XRP’s $1.10 level remains the key floor for the bullish case. A move toward $1.21 or $1.10 would fit the potential Wave C scenario. Until $XRP forms a complete five-wave rise, the current bounce may still be a temporary recovery.

 ambcrypto.com
 coinpedia.org