


 4
4
Pendle [$PENDLE] has continued to ride the bullish wave it has been on for months. In the past 180 days, it has seen a 73% rally, while on a year-to-date basis, it’s up 12%, a sign that bulls have a strong foothold in the market.
While the present trajectory is bullish, it remains pertinent to understand the short-term outlook for the asset. Currently, there might be another surge similar to what has already been witnessed.
A classic pattern in formation
The pattern that has formed on $PENDLE’s price chart suggests that the price still maintains the potential for a further upswing.
Price recently exited the right shoulder of the inverse head-and-shoulders pattern on the chart, overcoming the neckline resistance at $1.91, and it continues to swing higher.
This pattern often rallies by the depth of the decline, which is the distance between the neckline and the lowest level within the head structure, duplicating that move to the upside.
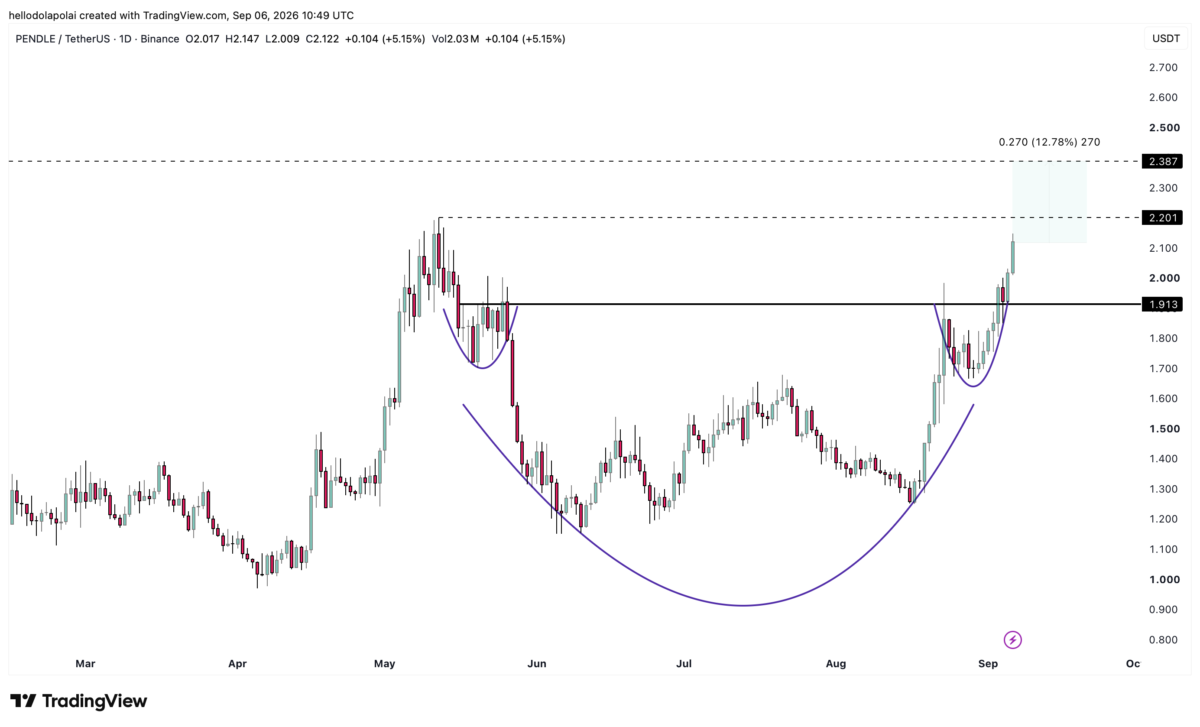
However, a more conservative target would be the $2.38 level on the chart, where there is a cluster of likely resistance. A surge to this level would mark an additional 12% gain from the price at press time.
If the momentum is sufficient, there is a high chance that the price continues to trend upward, potentially forming a new high for the year.
Momentum and capital flows
$PENDLE is benefiting from a strong rally as momentum in the market strengthens and investors continue to accumulate.
The Accumulation/Distribution indicator has since surged forward, with the total volume-weighted reading hitting 57 million $PENDLE while trending upward. This remains significant, as it confirms that accumulation is ongoing.
Notably, when $PENDLE accumulation hits 58 million, traders need to pay attention, as the price previously failed to breach this level, which was followed by a sharp price decline.
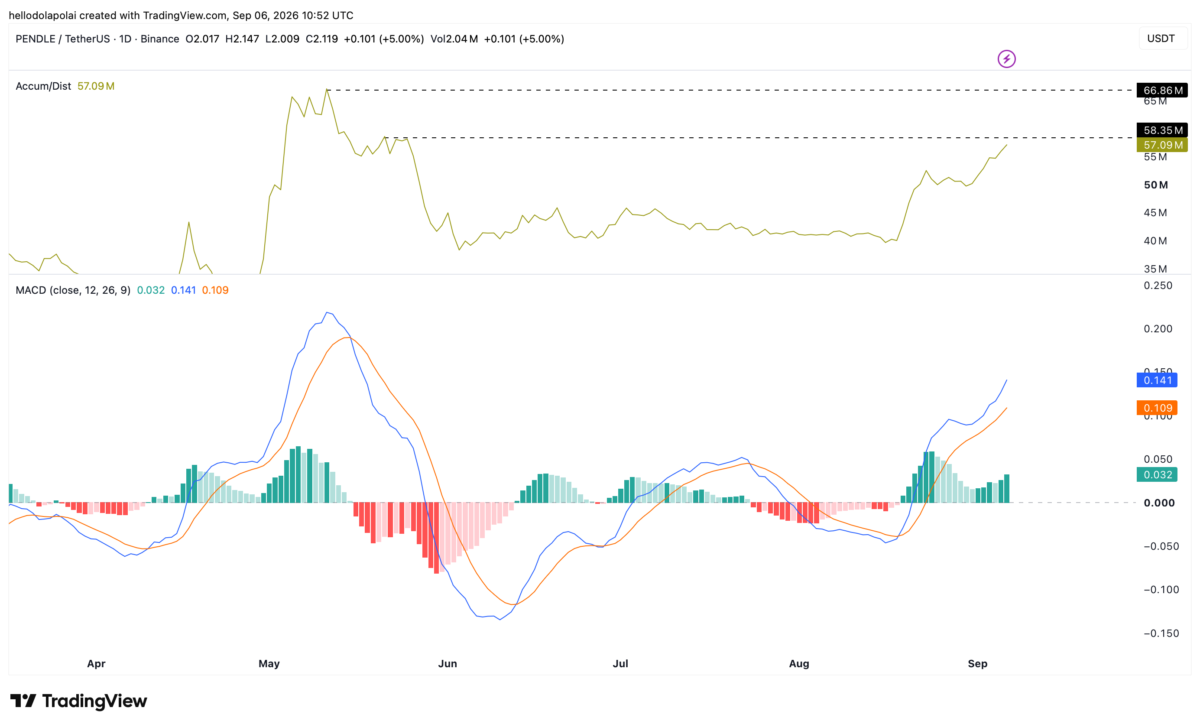
On the momentum side, the Moving Average Convergence Divergence (MACD) has continued to surge forward, trading higher in the positive zone.
With the blue MACD line at a reading of 0.141 and the orange signal line at 0.109 as of writing, there is a chance that the price will continue to swing higher.
Market sentiment remains positive
There is a clear sentiment in the market showing that investors are maintaining a bullish stance, and this level remains worth watching.
According to the sentiment chart, $PENDLE has a reading of about 3.71, at press time, implying that traders are bullish, but only mildly so.
The sentiment chart uses a scale between -10 and 10 to determine the bullish or bearish outlook, depending on where the reading falls on the chart.
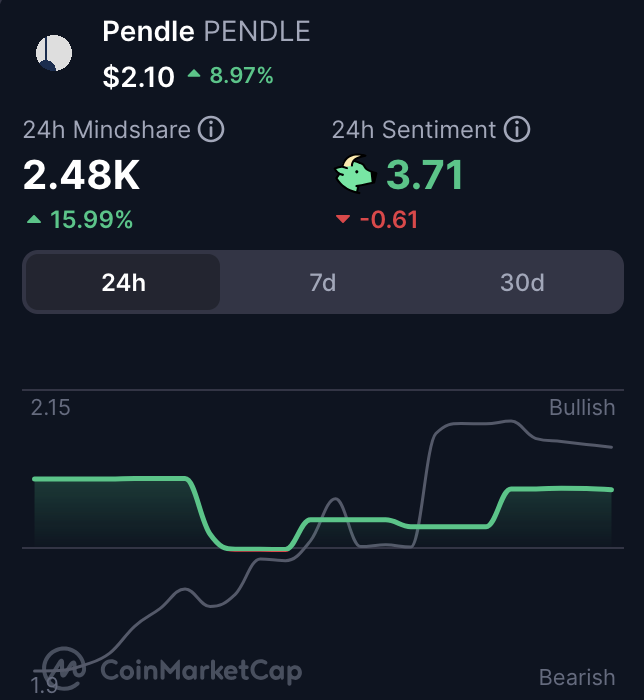
For now, the overall market reading and the sentiment shown on the chart suggest that $PENDLE remains moderately bullish.
Final Summary
- $PENDLE’s inverse head-and-shoulders breakout points to a potential move toward $2.30, representing a possible 12% gain.
- Rising Accumulation/Distribution and positive MACD suggest that buying pressure and momentum remain strong.

 crypto.news
 cryptopolitan.com
 news.bitcoin.com
