

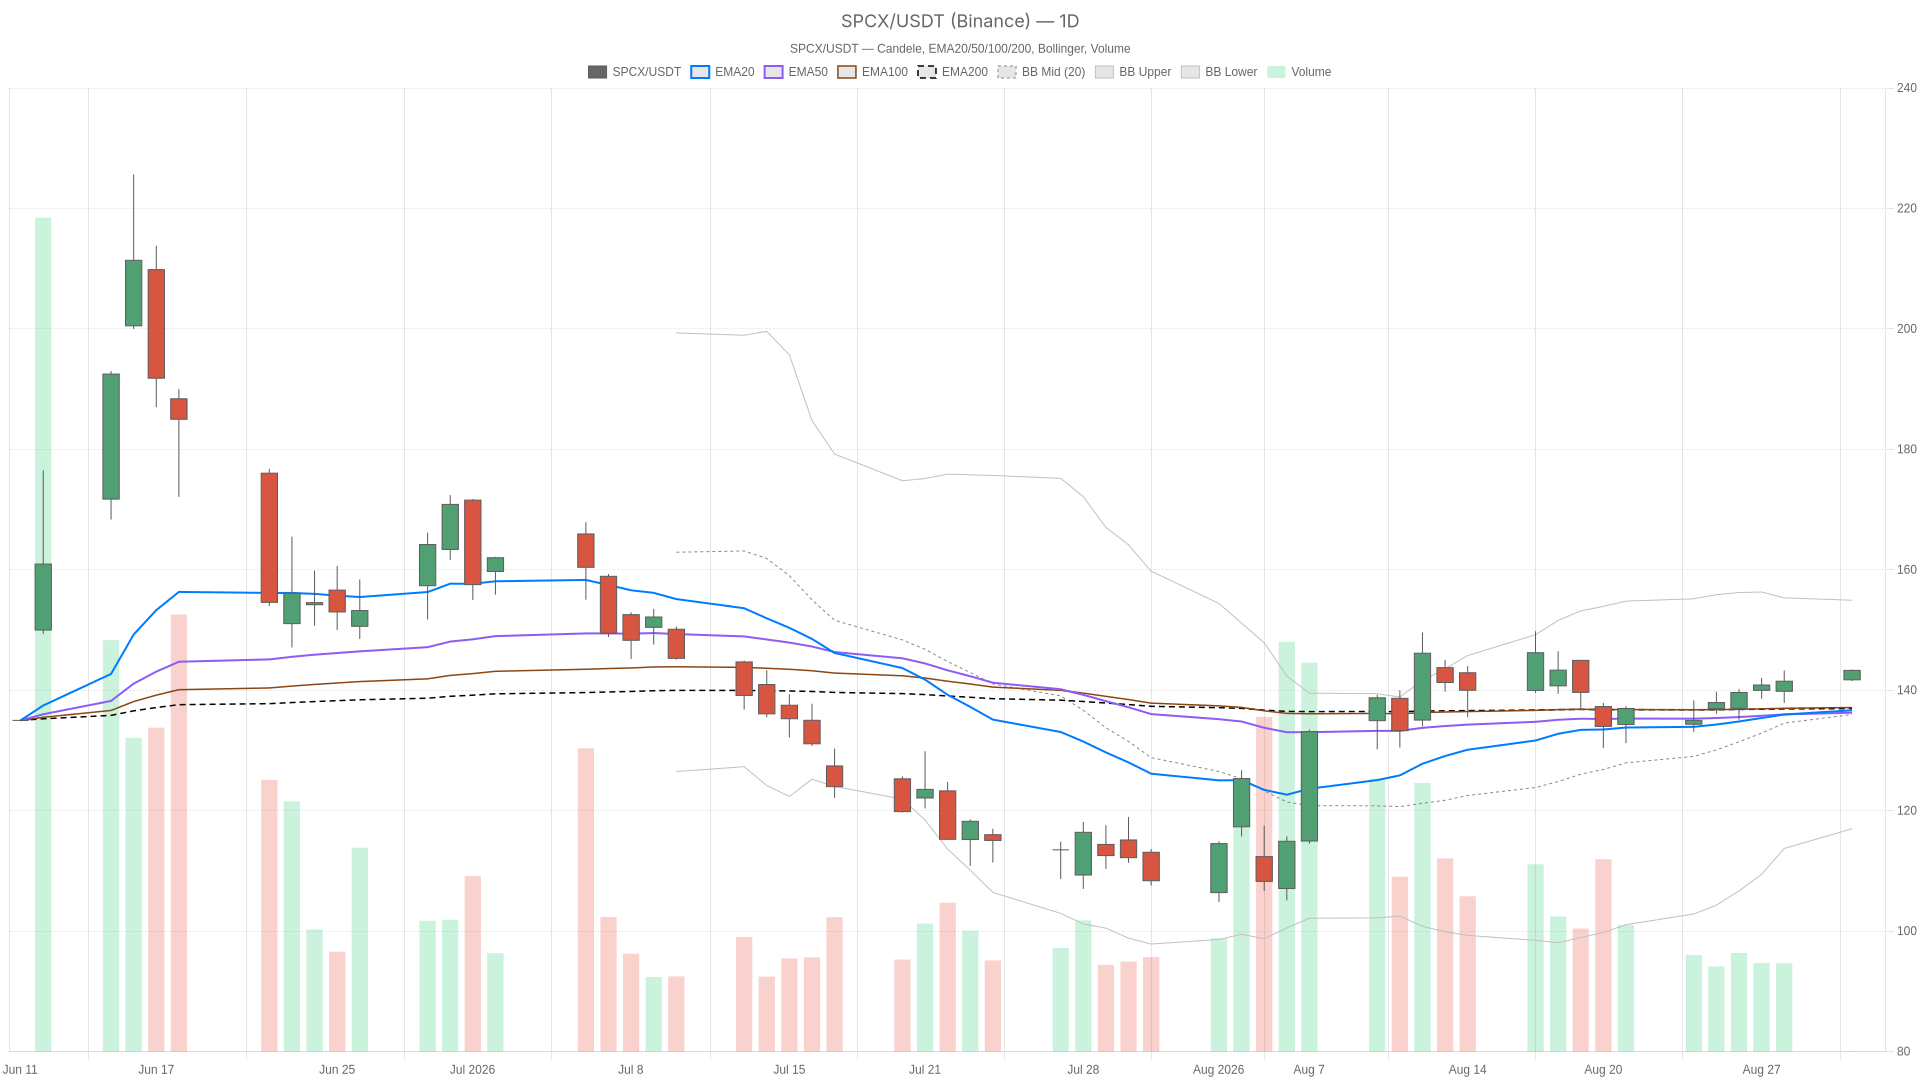
SpaceX stock closed at $143.30, up from $141.73. The tape tells a more constructive story than the daily indicator regime suggests. While the daily trend reads neutral, both the 1-hour and 15-minute charts are unmistakably bullish. That divergence is the central tension worth unpacking for anyone tracking SPCX.
Key takeaways
- SPCX closed at $143.30, trading above all three daily EMAs clustered near $136–137.
- Daily RSI14 at 57.03 and a positive MACD histogram of 0.92 signal building bullish momentum without overbought risk.
- Hourly and 15-minute charts confirm the bullish regime, though short-term RSI readings hint at a potential near-term consolidation.
- Cathie Wood’s Ark reportedly bought $27 million of SpaceX stock, reinforcing institutional confidence.
- Alphabet’s early SpaceX stake has grown from $900 million to approximately $94 billion as of June 30, 2026.
Daily Structure: Quiet Consolidation With a Bullish Undertone
For SpaceX stock, the daily chart sits constructively above all three key moving averages, even though the automated regime still reads neutral. The EMA20 at 136.67, the EMA50 at 136.27, and the EMA200 at 136.96 form a tight cluster within a one-point range. This points to a market that recently digested consolidation before price pushed away from it. Trading above the entire stack is typically a constructive signal.
Momentum Indicators Signal Building Strength
The daily RSI14 stands at 57.03, comfortably above the midline but nowhere near overbought territory. Meanwhile, the daily MACD line (2.69) sits well above its signal line (1.77), with a positive histogram of 0.92. That combination signals building bullish momentum. Notably, it does so without the exhaustion risk that typically accompanies a stretched RSI reading.
Volatility and Pivot Context Leave Room to Run
Bollinger Bands add useful context. The daily bands run from 117.01 on the lower side to 154.95 on the upper side, with the midline at 135.98. Price at 143.30 is trading in the upper half of that range. However, it still has meaningful room before testing the upper band. In other words, there is no immediate volatility-based ceiling forcing a reversal. The daily ATR14 of 7 frames the kind of day-to-day swings traders should expect.
The daily pivot structure reinforces the constructive tone. Price is trading above the pivot point at 142.76 and closing in on R1 at 143.98, while S1 sits at 142.08. That positioning above pivot is generally read as a mildly bullish tell for the session.
1H Timeframe: Confirmation, With a Caveat
The hourly chart confirms the bullish lean seen on the daily. EMA20 (140.41), EMA50 (139.00), and EMA200 (135.83) are all stacked in bullish order. Price is trading above every one of them. The hourly regime is explicitly tagged bullish, aligning with the daily’s underlying tone and strengthening the constructive case for SPCX.
However, momentum on the hourly chart is running hotter. RSI14 has climbed to 63.76. The MACD histogram, while still positive at 0.21, is notably smaller than its daily counterpart. This signals that hourly momentum may be starting to plateau. More telling is the Bollinger Band setup. The hourly upper band sits at 143.17. Price at 143.30 has already pushed slightly above it. That is a short-term overbought signal traders should not ignore, even within an otherwise healthy uptrend.
The hourly pivot levels frame the immediate battle zone. Pivot sits at 143.16, R1 at 143.58, and S1 at 142.87. Price hovers right at pivot and brushes against the upper Bollinger band. This suggests the next few hours could bring a pause or shallow pullback before any fresh push higher.
15-Minute Execution Context: Overbought, But Not Alarming
The 15-minute chart confirms the bullish structure but shows short-term overbought conditions. RSI14 here reads 70.32 — squarely in overbought territory. Price sits right against the upper Bollinger band at 143.39. EMA20 (141.36), EMA50 (140.59), and EMA200 (139.20) remain bullishly stacked. The regime tag is bullish as well. Therefore, the very short-term setup looks stretched, even as the broader trend remains intact.
For active traders, this simply means execution matters. A pullback toward the 15-minute pivot at 143.16 or even S1 at 142.87 would not damage the broader bullish structure. It would just represent normal digestion of a fast intraday move. Notably, none of the shorter-term overbought readings contradict the daily or hourly trend. They only suggest timing entries with patience rather than chasing strength directly into resistance.
The News Backdrop Supports the Bullish Case for SpaceX Stock
Fundamentally, the tape has plenty of tailwinds. Cathie Wood’s Ark reportedly bought $27 million of SpaceX stock, a signal of continued institutional appetite. Separately, reports of a $100 billion buildout planned in Louisiana for Starship underline the scale of long-term infrastructure investment behind the company. The project is expected to create between 3,000 and 10,000 jobs.
Perhaps most striking is the disclosure that Alphabet’s early SpaceX stake has delivered extraordinary returns. Worth roughly $900 million back in 2015, it is now valued at about $94 billion as of June 30, 2026. That represents more than 100 times the original investment. This kind of long-duration value creation tends to anchor investor confidence even through short-term volatility.
At the same time, a Seeking Alpha piece flagged 92% revenue growth alongside Starlink’s continued surge. However, it also pointed to heavy AI-related capital expenditure and cash burn tied to debt-fueled expansion. That nuance is worth holding onto. The growth story is real, but it is being financed aggressively. The balance between expansion and leverage is a factor worth monitoring over time.
Bullish Scenario
The bullish case for SpaceX stock rests on two pillars. First, the daily structure holding above the EMA cluster near 136–137. Second, the positive MACD histogram continuing to expand. A clean break above the daily R1 at 143.98 would open the door toward testing higher levels. Confirmation would come from hourly price holding above its own pivot at 143.16. The still-wide Bollinger range extends up to 154.95. Continued institutional buying interest would reinforce the fundamental underpinning of that technical move. The scale of announced infrastructure projects like the Louisiana buildout adds further weight.
Bearish Scenario
On the other hand, the bearish risk for SpaceX stock is more about short-term exhaustion than a structural trend break. A rejection at the hourly and 15-minute upper Bollinger Bands could trigger a pullback. The already overbought 15-minute RSI of 70.32 adds weight to that near-term caution. Price could drift toward the daily pivot at 142.76 or even S1 at 142.08.
In contrast, a deeper break below the daily EMA50 at 136.27 and EMA200 at 136.96 would meaningfully invalidate the bullish thesis. That remains a significant distance from current price. The more immediate risk is simply a cooling-off period after the recent run. This is especially relevant given the debt-fueled cash burn dynamics flagged in the fundamental coverage.
Closing Take
Overall, the setup in SpaceX stock reflects a market where the daily trend is quietly turning constructive. Its own regime classification still reads neutral, but hourly and 15-minute charts have already confirmed the bullish tilt. Short-term overbought readings suggest the next move may not be a straight line higher. Volatility, measured by a daily ATR14 of 7, leaves room for meaningful swings in either direction. The mix of strong fundamental catalysts and stretched short-term momentum makes the behavior around the daily pivot and R1 levels worth watching in the sessions ahead.
FAQ
What does the neutral daily regime mean for SpaceX stock?
The daily regime classification reads neutral, but the underlying structure tells a more constructive story. Price sits above all three key EMAs, the MACD is positive, and RSI14 stands at 57.03. The 1-hour and 15-minute charts already confirm a bullish tilt. This suggests the daily label may be lagging the actual price action rather than indicating genuine weakness.
What is the key support level for SPCX right now?
The daily EMA cluster near $136–137 serves as the critical support zone. This includes the EMA20 at $136.67, the EMA50 at $136.27, and the EMA200 at $136.96. A decisive break below this cluster would invalidate the bullish thesis.
Is SPCX overbought on any timeframe?
Yes. The 15-minute RSI14 reads 70.32, squarely in overbought territory. Additionally, price has pushed slightly above the hourly upper Bollinger band at $143.17. This suggests a short-term pause or shallow pullback may be near, even within the broader uptrend.
What fundamental catalysts support the bullish case?
Key tailwinds include Cathie Wood’s Ark purchasing $27 million of SpaceX stock and a planned $100 billion Starship buildout in Louisiana. Alphabet’s early SpaceX stake has also grown from $900 million to approximately $94 billion, reinforcing long-term institutional conviction.
Disclaimer: This article is for informational purposes only and does not constitute financial advice, an investment recommendation, or a solicitation to buy or sell any financial instrument or cryptocurrency. The analysis provided is not indicative of future results. Investing in crypto assets and financial markets carries a high risk of capital loss. Always do your own research (DYOR) and consult a qualified financial advisor before making any decision.
Article produced with the assistance of artificial intelligence and reviewed by the editorial team.

 coinpedia.org

 beincrypto.com

 u.today