


 1
1
- Pudgy Penguins is hovering around $0.0059.
- $PENGU’s momentum is improving in the short term.
Pudgy Penguins ($PENGU) is under bearish pressure as the bears have continued to dictate its price trajectory over the last 30 days. It has been attempting to attract the bulls to escape the downside trading pattern. Also, the technical structure remains negative.
The bearish price alignment confirms that sellers continue to dominate the broader market trend of $PENGU. Only the potential entry of buyers will likely flip the broader momentum and turn the chart green.
Moreover, as per CoinGecko, Pudgy Penguins is currently trading near the $0.005944 mark. Notably, the 24-hour price range falls between $0.005906 – $0.006085. The daily trading volume has reached the $52.778 million mark.
Pudgy Penguins’ Key Support and Resistance Levels
The short-term trading pattern depends on a few upcoming crucial price ranges. Pudgy Penguins’ immediate support might be at $0.005921, followed by a level below $0.0059. A deeper zone between $0.005857 – $0.0058 is a pivotal zone that decides whether the asset stabilises or continues to fall.
On the other hand, the first recovery level of $PENGU would likely be at $0.005966. The price action needs to push through $0.0060 to show stronger momentum. With the next resistance levels sitting near $0.006049 and $0.0061, the higher targets of the token are aimed to be broken.
Is $PENGU’s Technical Setup Hinting at More Downside?
While zooming in on the four-hour chart, the Moving Average Convergence Divergence line is above the signal line. A brief bullish crossover has occurred, and short-term buying pressure is outperforming the recent average rate, driving a temporary recovery move.
Both lines are below zero, with the broader market remaining in a downtrend. Long-term momentum is still weighted to the downside. Momentum is improving short-term, but price has not cleared the overall downward pull yet. Traders look for the MACD to push back above zero for a serious trend reversal.
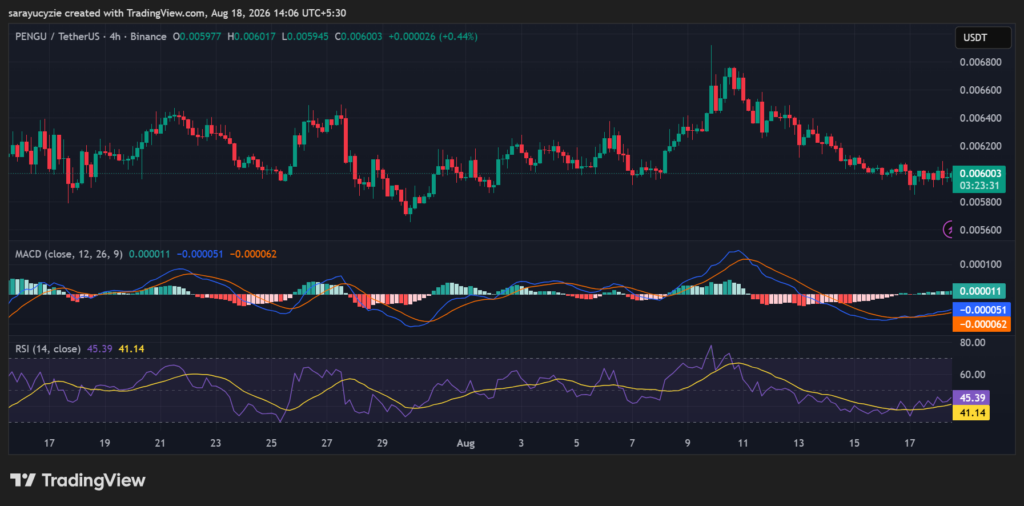
In addition, the daily Relative Strength Index reading is stationed at 45.39, suggesting a neutral market with a minor bearish tilt. The 50 level is absolute balance, and being under 50 shows that short-term selling pressure is slightly stronger than buying power.
As it is sitting above 30, the asset is not oversold; there is no pressure for an immediate bounce. An RSI in the mid-40s reflects a lack of strong buying conviction, accompanying sideways consolidation. Buyers lack the energy to push the trend up, but sellers are not aggressively dumping the asset either.

 invezz.com
 cryptoslate.com
 en.cryptonomist.ch
