


 4
4
Venice Token has regained attention after its price climbed sharply alongside stronger growth from the Venice AI platform. $VVV recently traded near $13.71, marking a 12.29% daily gain. The token also gained 16.30% over seven days, according to the supplied market data. Moreover, trading activity reached more than $20 million during the latest 24-hour period.
The rally gained momentum after Venice co-founder Erik Voorhees highlighted significant growth in annualized revenue. Venice reportedly surpassed $100 million in annualized revenue after reaching $70 million recently.
Venice Token leads daily gainers as co-founder reports $100 million in annualized revenue
— BSCN (@BSCNews) August 17, 2026
Venice Token base:0xacfe6019ed1a7dc6f7b508c02d1b04ec88cc21bf rose about 7% to $12.64 today, topping CoinMarketCap's daily gainers among major tokens with volume up over 140%. The move… pic.twitter.com/FP6pmJH5TR
Revenue Growth Strengthens the Bullish Narrative
Venice’s reported revenue growth provides an important fundamental backdrop for $VVV’s latest recovery. The platform reportedly generated more than $70 million in annualized revenue by July 1. It later crossed the $100 million annualized revenue mark within roughly six weeks.
Significantly, the platform reportedly reached profitability during the first quarter. Venice also claims approximately 3.5 million users and 1.7 million daily API calls. Additionally, its token model creates demand through API credit usage and $VVV burns.
The project has reportedly burned 33.7 million $VVV, representing roughly 42% of the supply. Meanwhile, the team reportedly holds more than 30 million $VVV without selling. These figures could strengthen the long-term scarcity narrative if platform activity continues expanding.
Venice AI [ $VVV ] just crossed $100M annualized ↓
— Chain INK (@0xchainink) August 17, 2026
> $70M ARR on July 1. $100M now
> Profitable since Q1
> $1B valuation, $65M from Dragonfly
> 3.5M users, 1.7M API calls daily
> 33.7M $VVV burned, 42% of supply
> $5 per $100 of API credits burns $VVV
> Team holds 30M+ $VVV, zero… https://t.co/uDXwA33wXI
Venice also carries a reported $1 billion valuation following a $65 million investment from Dragonfly. Hence, continued revenue expansion could become increasingly important for $VVV’s market valuation.
$VVV Technical Structure Turns Bullish
$VVV’s four-hour chart currently shows a notable short-term reversal. The token has reclaimed its 20, 50, and 100 exponential moving averages. Price now approaches the $13.50 Fibonacci resistance zone.
This level represents the immediate test for buyers after the latest advance. A sustained four-hour close above $13.50 could confirm stronger upside momentum. Consequently, the next major target sits around $14.50.
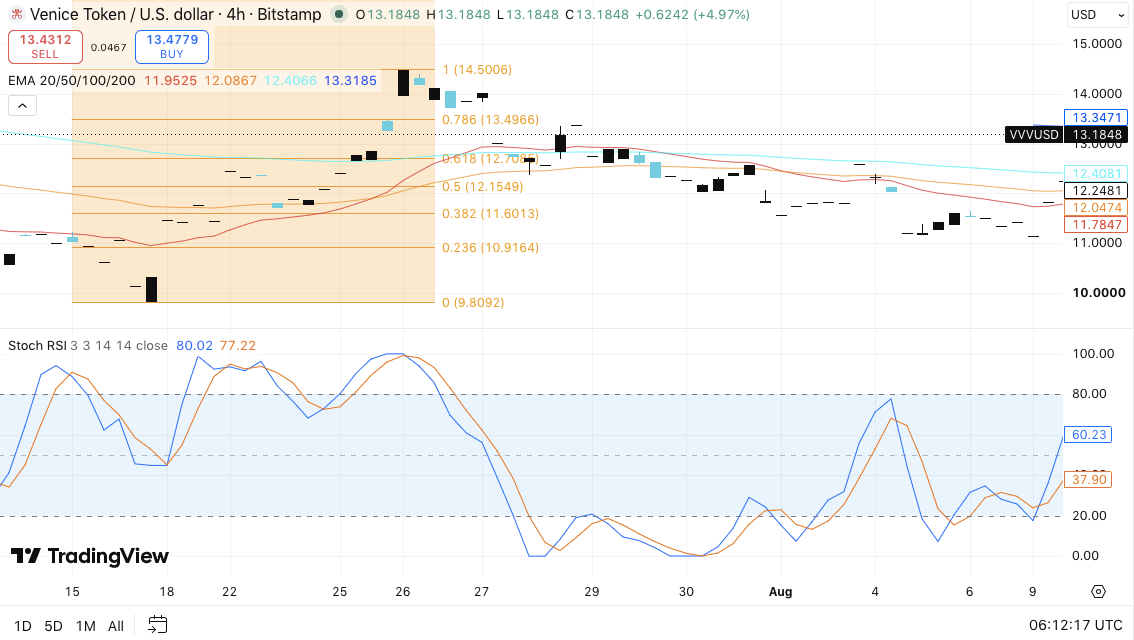
A move through $14.50 could expose the psychological $15 level. However, traders should watch momentum indicators closely because the Stochastic RSI has risen sharply. The indicator now approaches overbought territory, which increases the possibility of short-term profit-taking.
Related: PI Price Prediction Holds Steady At $0.086 As Pi Network Overhauls App Economy
$VVV could find initial support between $13.18 and $13.00 if sellers emerge. Below that zone, the $12.70-$12.41 region remains important. The area contains the 50 and 100 EMA cluster, giving buyers another potential defense zone.
Falling Open Interest Creates a Warning
Despite the stronger price action, derivatives participation remains considerably weaker than during $VVV’s earlier rally. Open interest surged above $120 million during May and briefly approached $140 million.
The metric subsequently entered a prolonged decline through June and July. Several rebounds failed to establish a sustained recovery in leveraged participation.
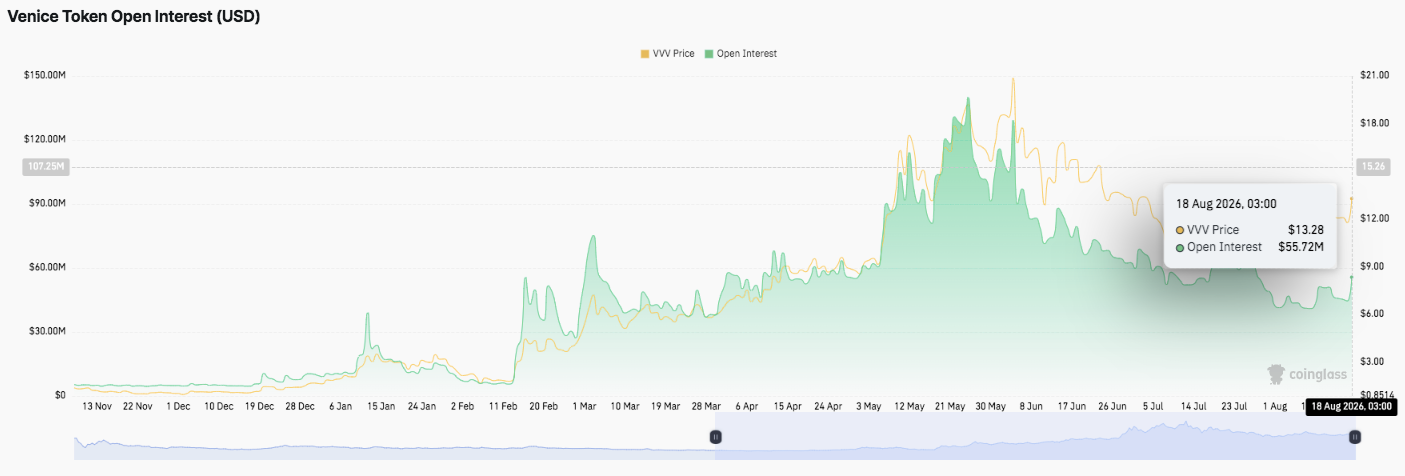
By August 18, open interest stood near $55.72 million. That figure remains significantly below the previous peak despite $VVV’s recent price recovery.
This divergence creates an important signal for traders. Price has strengthened while leverage remains relatively subdued. Therefore, the current rally may reflect improving spot demand rather than aggressive derivatives speculation.
However, rising open interest alongside further price gains could strengthen the bullish case. Such a move would indicate that fresh positions support the ongoing recovery.
Spot Flows Remain a Key Risk
$VVV’s spot flow data presents a more cautious picture. Inflows increased during April and May as the token approached the $20 region. However, large negative netflows emerged during late May and June.
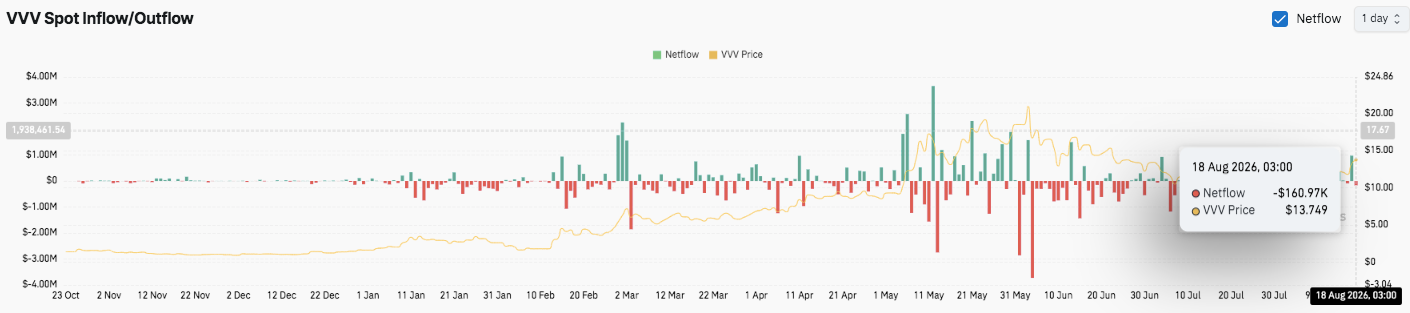
July continued to produce alternating inflows and outflows. Yet, outflow spikes generally outweighed buying activity. By August 18, netflow stood near negative $160,970 while $VVV traded around $13.75.
Technical Outlook for Venice Token Price
Key levels remain well-defined for Venice Token as $VVV attempts to extend its recent recovery:
Upside levels: $13.50 is the immediate resistance, followed by $14.50 and $15.00. A decisive breakout above $14.50 could strengthen momentum toward the psychological $15.00 level.
Downside levels: $13.18–$13.00 represents the first support zone, followed by $12.70–$12.41 around the 50- and 100-EMAs. A deeper correction could expose $12.25 and $11.60.
Resistance ceiling: $13.50 is the key level to flip for stronger bullish momentum. A sustained 4H close above this area could confirm the reversal and attract fresh buying interest.
Will Venice Token Go Up?
$VVV’s near-term direction hinges on whether buyers can break and hold above $13.50. Stronger spot demand and rising open interest could support a move toward $14.50 and $15.00. However, persistent spot outflows and subdued open interest could trigger profit-taking.
Failure to defend $13.00 would increase downside risks toward $12.70–$12.41. For now, $VVV remains at a pivotal technical level, with improving Venice AI fundamentals providing a potential catalyst for the next major move.

 invezz.com
 coindesk.com


 beincrypto.com

 coincodex.com