

The $XRP price is trading at $0.9996 at the time of writing. Not above $1. Not comfortably below it. Exactly on the line that has defined the token's entire summer.
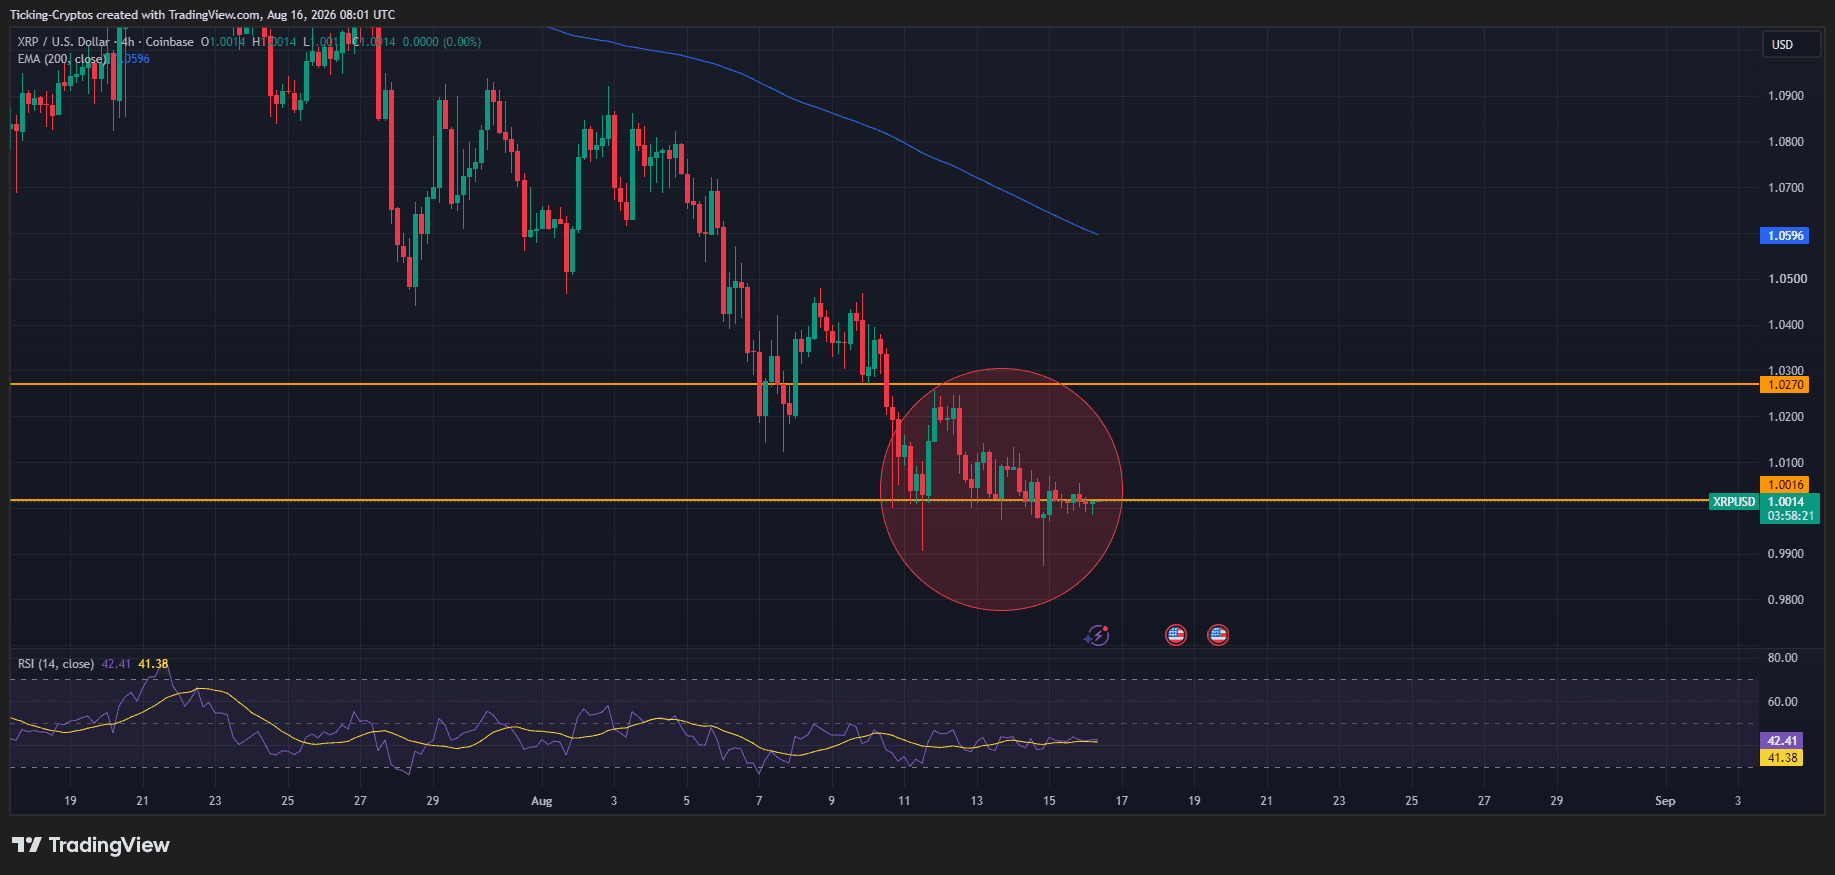
The weekly candle tells the story better than any headline: open at $1.0289, high at $1.0402, low at $0.9852, close at $0.9996, down 2.87% on the week. $XRP has now poked below the psychological $1 mark several times in August and clawed its way back each time, but every recovery has been weaker than the last. The bounces are getting smaller, the closes are getting lower, and the buyers who defended this level in June and July are visibly running out of ammunition.
That matters far more than it sounds, because $XRP is not falling on its own bad news. It is falling in a market where Bitcoin itself is struggling. And if $BTC loses its own footing, $XRP does not have a soft landing waiting below.
Why is the $1 level so important for $XRP?
$1 is the last structural support $XRP has left before a long air pocket down to $0.90 and $0.80. It is not just a round number, it is where buyers have repeatedly stepped in since late June, and it is now the only thing separating $XRP from levels it has not traded at in almost two years.
Round numbers matter in crypto because they concentrate orders. Stop losses cluster just beneath them, limit buys stack just above them, and derivatives desks build positions around them. $XRP has spent roughly two months grinding sideways against this line, which means an enormous amount of leverage has been built directly on top of it.
When that kind of level breaks with conviction rather than in a wick, the resulting move is rarely orderly. The stops trigger, the liquidations cascade, and the price does not stop at the first sign of demand. It stops where the next real bid sits.
What do the charts actually say about $XRP right now?
$XRP is trading below its 200-week EMA at $1.3745, its weekly RSI has fallen to 31.02 against a signal line at 33.50, and the entire structure since March has been a clean series of lower highs and lower lows.
Break that down:
- The 200 EMA at $1.3745 is now overhead resistance, not support. $XRP lost it in May and every attempt to reclaim it since has been rejected. Until price closes back above it, the weekly trend is bearish by definition.
- Weekly RSI at 31.02 is nearly oversold, but on a weekly timeframe that is not automatically bullish. Oversold in a downtrend usually means the trend is working, not that a reversal is due. RSI can sit in the low 30s for months.
- RSI below its signal line means momentum is still deteriorating, not stabilising.
- The rejection map above is brutal: $1.20, $1.30, the EMA at $1.3745, then $1.50 and $1.80. Every single one of those was support on the way down. They are all resistance now.
The performance table underlines how relentless this has been. $XRP is down 3.80% over one week, 7.99% over one month, 32.78% over six months, 45.67% year to date, and 67.54% over twelve months. Even the five year figure is negative at 22.29%. This is not a healthy asset taking a breather. This is an asset in a sustained, multi-quarter distribution.
Want to buy the dip or build a position gradually? Buy $XRP on Bitpanda with the signup code CRYPTOTICKER. Regulated in the EU, with savings plans that let you average into positions instead of timing a falling market.
What happens to $XRP if Bitcoin drops?
This is the part most $XRP holders are underestimating.
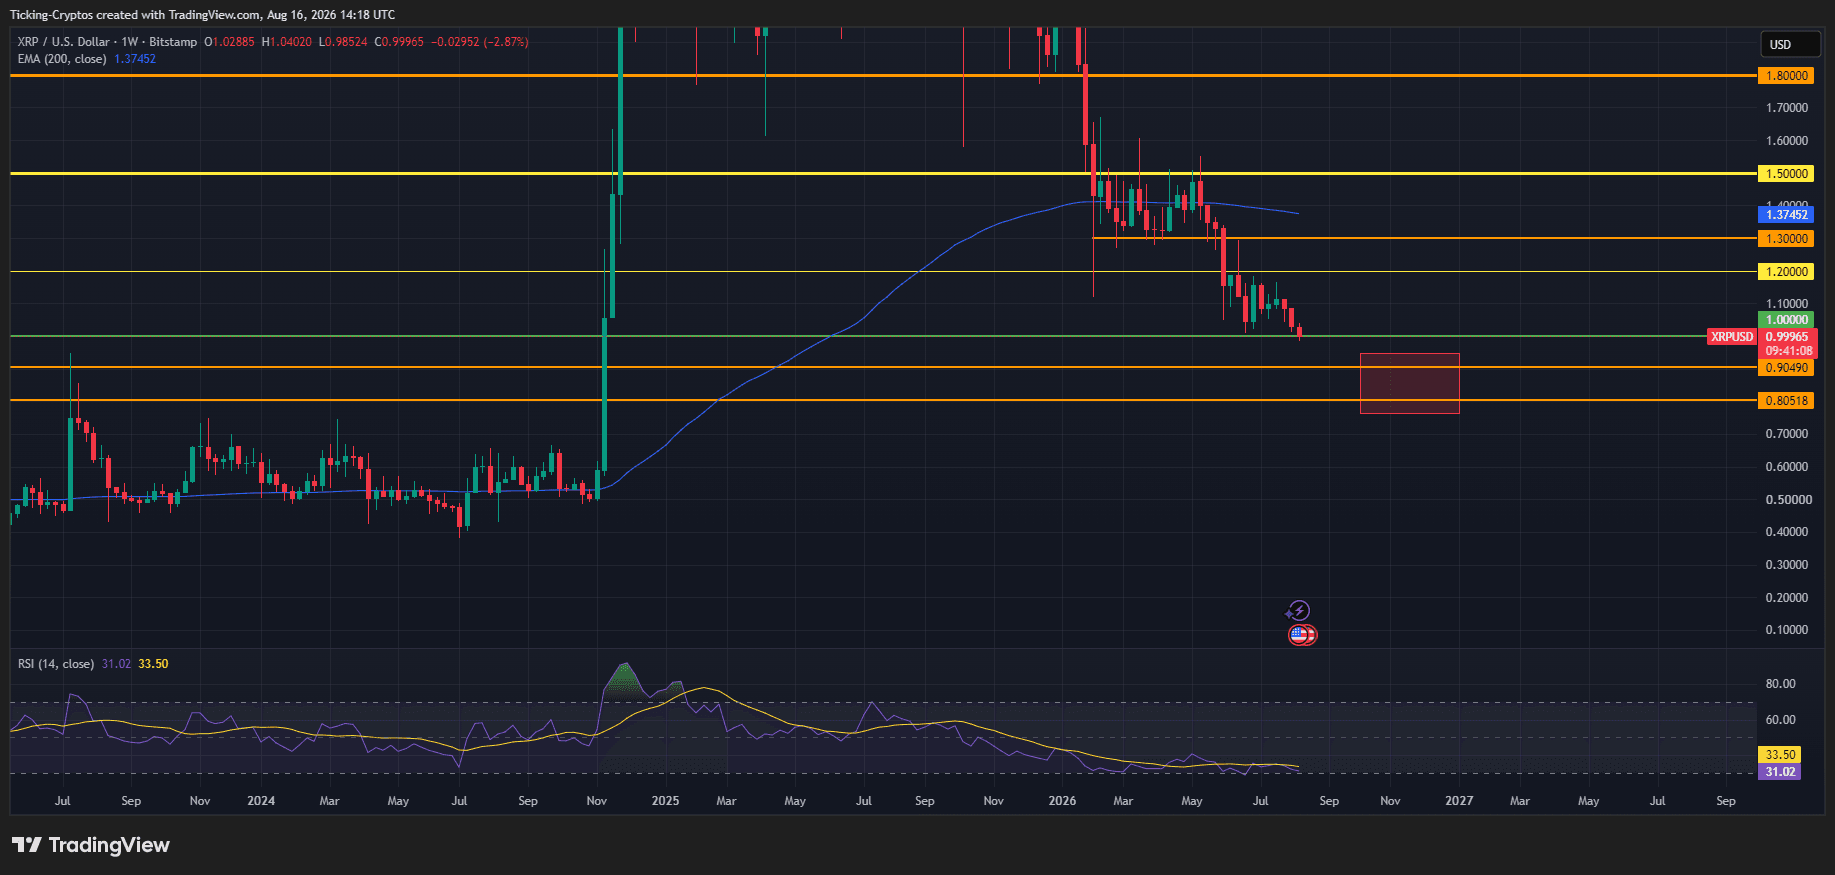
$XRP has no independent bid right now. If Bitcoin breaks below $60,000, $XRP loses $1 almost mechanically, and the next levels that offer any real support are $0.9049 and $0.8052.
Bitcoin is currently stuck around $63,000 after repeatedly failing to reclaim $65,000. Analysts are watching support in the $60,000 to $61,000 zone, with resistance stretching toward $65,000 to $66,000, and the 0.618 Fibonacci retracement near $57,825 marked as the clearest support on the weekly chart. In other words, $BTC has maybe 4% of cushion before it enters a zone where its own structure starts breaking.
Altcoins do not fall proportionally with Bitcoin in these moments. They fall harder. A 5% $BTC drawdown routinely translates into 8% to 12% on a weak large cap altcoin, and $XRP is currently one of the weakest large caps in the market by flow data. If $BTC slides from $63,000 toward $57,800, that is a 8.3% move for Bitcoin. Applied to $XRP with a typical high beta multiplier, that alone would put $XRP in the $0.85 to $0.90 region without a single piece of $XRP-specific bad news.
That is the asymmetry $XRP holders need to understand. $XRP does not need its own catastrophe. It just needs Bitcoin to have a bad two weeks.
$XRP Price Prediction: Where is the next support if $XRP loses $1?
The two levels that matter are $0.9049 and $0.8052. Between $1 and $0.90 there is very little historical trading activity, which means the drop can be fast and shallow on volume.
Here is the downside map:
| Level | Type | Distance from $0.9996 |
|---|---|---|
| $1.0000 | Current battleground | 0% |
| $0.9049 | First major support | -9.5% |
| $0.8052 | Second major support | -19.5% |
| $0.6200 | Deeper structural zone | -38% |
The $0.90 area is the first genuine test. It lines up with prior consolidation from the 2024 range and it is where a lot of longer-term accumulation sat before the late-2024 breakout. If sellers push through it, $0.8052 becomes the line that decides whether this is a deep correction or a full retrace of the entire 2024 to 2025 move.
Below $0.80 the chart is essentially empty until the $0.60 region. That is not a prediction, it is just what the volume profile looks like.
Why is nobody buying $XRP at these levels?
Because the institutional money that was supposed to be $XRP's catalyst simply is not showing up.
Weekly net inflows into US spot $XRP ETFs collapsed 93% to $1.01 million for the week ending August 8, down from $14.86 million the previous week, even though the seven spot $XRP ETFs hold roughly $1 billion in combined assets. There have been multiple days this month with literally zero net flow activity, something Bitcoin and Ethereum ETFs did not experience once over the same stretch.
Meanwhile, the CLARITY Act missed its window before the Senate recess, which pushes any legislative clarity on $XRP's commodity status to September at the earliest. The single biggest regulatory catalyst on $XRP's calendar has been kicked down the road, and the market has repriced accordingly.
There is one genuine counterpoint. Whale wallets holding more than 10 million $XRP have been absorbing over 10 million tokens per day, and large holder outflows from Binance now account for 91% of total exchange outflows, the highest concentration since 2024. Someone with size is buying. Whether that is conviction accumulation or slow-motion bag catching will only be clear in hindsight, and whales have been early before.
What would actually turn $XRP bullish again?
$XRP needs a weekly close above $1.22 to neutralise the immediate bearish structure, and a reclaim of $1.30 to $1.3745 to genuinely flip the trend.
The sequence looks like this:
- Defend $1 on a weekly closing basis, not just intraweek wicks.
- Reclaim $1.20 to $1.22, which would break the run of lower highs since May.
- Close above $1.30, the last major horizontal resistance.
- Reclaim the 200 EMA at $1.3745, which would be the first real trend change signal since spring.
Realistically, step one is the only thing on the table this month. Everything above requires either a Bitcoin recovery above $70,000 or a hard regulatory catalyst, and neither is scheduled before September.
What should $XRP holders watch this week?
- The weekly close. A weekly candle that closes below $0.985 confirms the breakdown. A close back above $1.05 buys time.
- Bitcoin at $60,000. This is the trigger level for the whole altcoin complex, $XRP included.
- $XRP ETF flow reports, published every Monday. Four consecutive weeks below $5 million would confirm the demand collapse is structural rather than seasonal.
- Whale accumulation data. If the large wallets stop buying while price falls, the last remaining bid disappears.
The bottom line
$XRP is not in a dip. It is in a downtrend that has now compressed against its final support, with weekly momentum deteriorating, institutional flows evaporating, and its main regulatory catalyst delayed to September. The token has broken below $1 several times already, and each defence has been thinner than the last.
The dangerous part is not $XRP's own chart. It is that $XRP has become almost entirely a leveraged expression of Bitcoin's direction, and Bitcoin is sitting 4% above a support zone that analysts already consider the last clean line on the chart. If $BTC goes, $XRP does not drift lower. It gaps to $0.90, and if that fails, $0.80.
For traders, the levels are simple: $1 decides everything, $1.22 changes the picture, $0.9049 and $0.8052 are where you find out how bad it gets.
Prefer trading crypto and equities from one regulated account? Open an account with XTB, a regulated broker with EEA approval for spot crypto trading.

 blockchainreporter.net
 ambcrypto.com
 coincodex.com
 cryptoslate.com