

Pump.fun’s $PUMP token climbed 27% from its Aug. 8 low as record weekly fees strengthened its buyback-and-burn program, while buyers absorbed volatility around a 6.875 billion-token unlock.
$PUMP price holds near $0.0028 after 27% rally
According to data from crypto.news, $PUMP price traded near $0.00279 on Aug. 13 after rising from approximately $0.0022 on Aug. 8. The token briefly reached an intraday high of $0.002895 before buyers and sellers settled around the $0.0028 area.
The move gave $PUMP a gain of roughly 27% over five days, even after the token encountered profit-taking near $0.0029. Its Aug. 13 daily candle remained 1.34% higher at the time the chart was captured.
Price action over the past month shows a wider trend reversal. $PUMP recovered from a June low near $0.0012 and broke above a series of lower highs that had controlled the market since February.
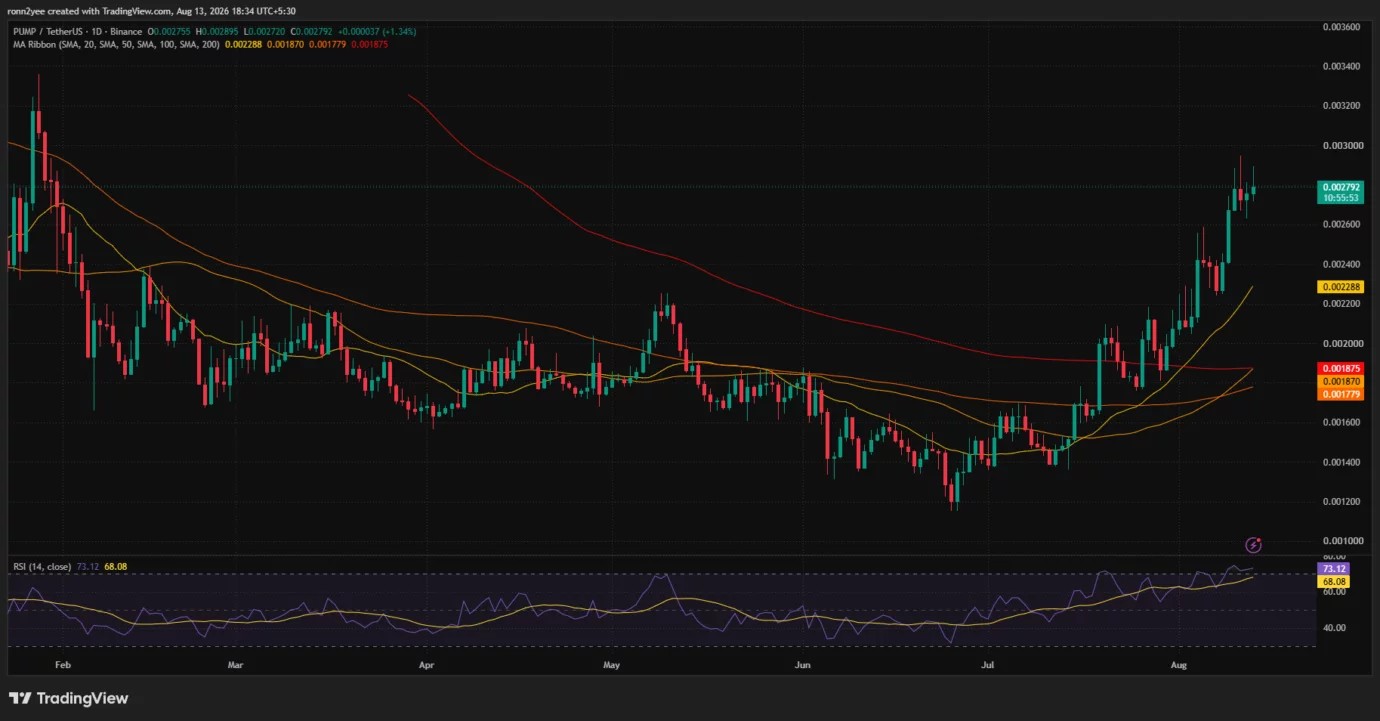
The token has now moved above its 20-, 50-, 100-, and 200-day simple moving averages. The 20-day average sits at $0.002288, while the other three averages are grouped between $0.001779 and $0.001875.
Trading above all four levels indicates that buyers control both the short- and medium-term trend. However, the large distance between $PUMP and its 20-day average also shows that the rally has become extended.
The daily relative strength index reached 73.12, above the commonly watched overbought threshold of 70. The RSI average is lower at 68.08, showing that momentum remains positive but increases the chance of consolidation or a temporary pullback.
Buybacks support $PUMP despite scheduled supply increase
Pump.fun’s fee growth provided the main fundamental support for the rally. The Solana-based token launch platform generated $10.03 million in fees between Aug. 3 and Aug. 9, according to data previously reported by crypto.news.
Ecosystem trading volume reached $2.97 billion during the same period, its highest level since late January. The figure was not an all-time high, but it showed a strong recovery in activity across Pump.fun and its related trading products.
Under Pump.fun’s current token model, half of the protocol fees are used to purchase $PUMP from the open market and burn the acquired tokens. The project’s token page confirms that 50% of protocol fees fund the program.
The latest weekly allocation resulted in $5.02 million of purchases and the removal of 2.15 billion $PUMP from circulation. Regular market purchases provide a recurring source of spot demand, while burning the tokens prevents them from returning to circulation.
However, $PUMP also faced a larger scheduled supply event. DefiLlama’s unlock schedule showed 6.875 billion tokens becoming available on Aug. 12, including 4.167 billion assigned to the team and 2.708 billion for existing investors.
The unlocked amount represented about 1.75% of the circulating supply and was worth approximately $19.2 million at the prevailing price. An unlock does not prove that holders sold their tokens, but it increases the amount that could enter the market.
$PUMP’s ability to remain near $0.0028 after the event suggests that available demand has so far prevented a deeper reversal. Still, future transfers from team or investor wallets could create additional pressure if recipients move substantial amounts to exchanges.
$PUMP technical setup points to $0.003 resistance
The 4-hour chart shows $PUMP consolidating after its latest advance rather than immediately surrendering the breakout. Price remains above the Bollinger Band midpoint at $0.002757, with the lower band at $0.002667.
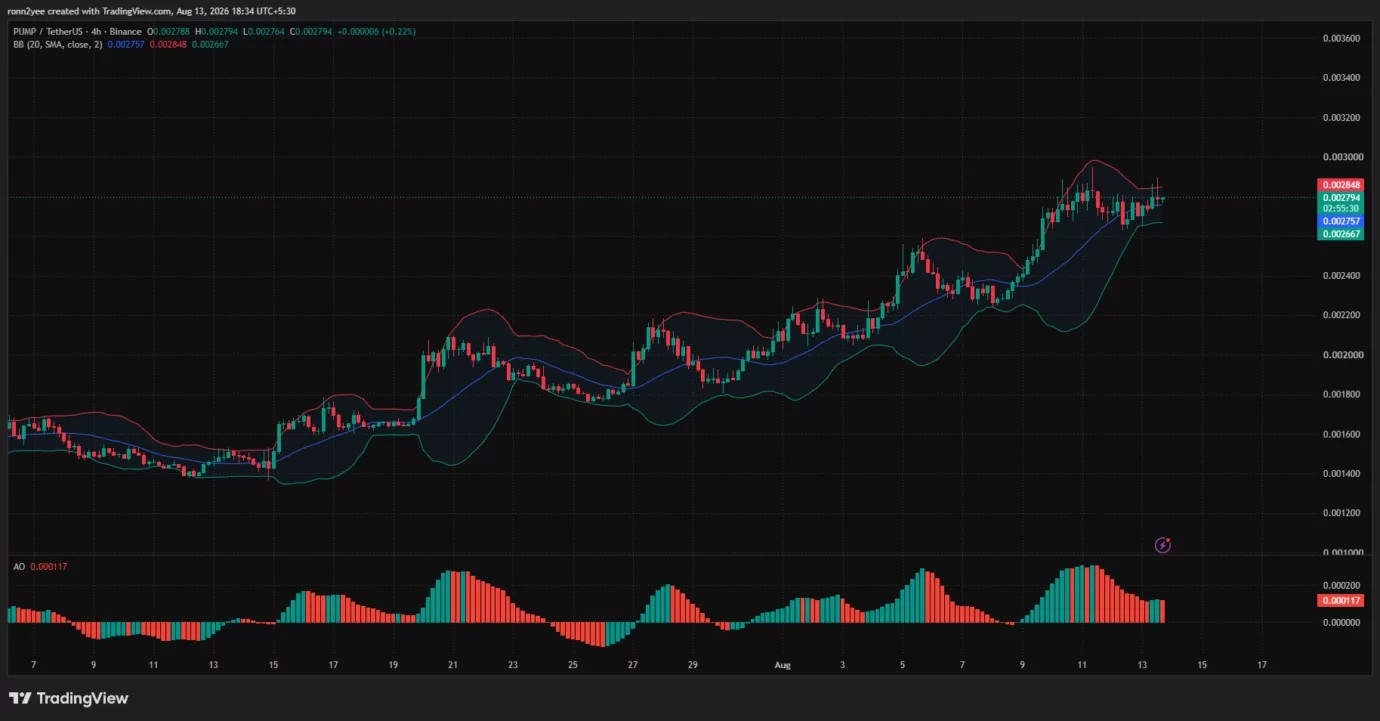
The upper band stands at $0.002848, close to the latest intraday high. A 4-hour close above that band would put the $0.0029–$0.0030 area back in focus.
The $0.0030 level carries both technical and psychological importance. It sits near the upper end of the latest price range and could attract selling from traders who entered during the July recovery.
The Awesome Oscillator remains positive at 0.000117, confirming that short-term momentum favors buyers. Its histogram has weakened from the Aug. 11 peak; however, indicating that the rate of price acceleration is slowing.
Immediate support sits around $0.00275, where the 4-hour Bollinger midpoint is located. A loss of that level could send $PUMP toward the lower band at $0.00267.
A deeper correction would bring $0.0025 into view. That area previously acted as resistance and could now serve as breakout support. Holding above it would preserve the wider sequence of higher highs and higher lows.
Liquidation clusters could increase $PUMP volatility
CoinGlass’ 24-hour liquidation heatmap shows leverage building on both sides of the current price.
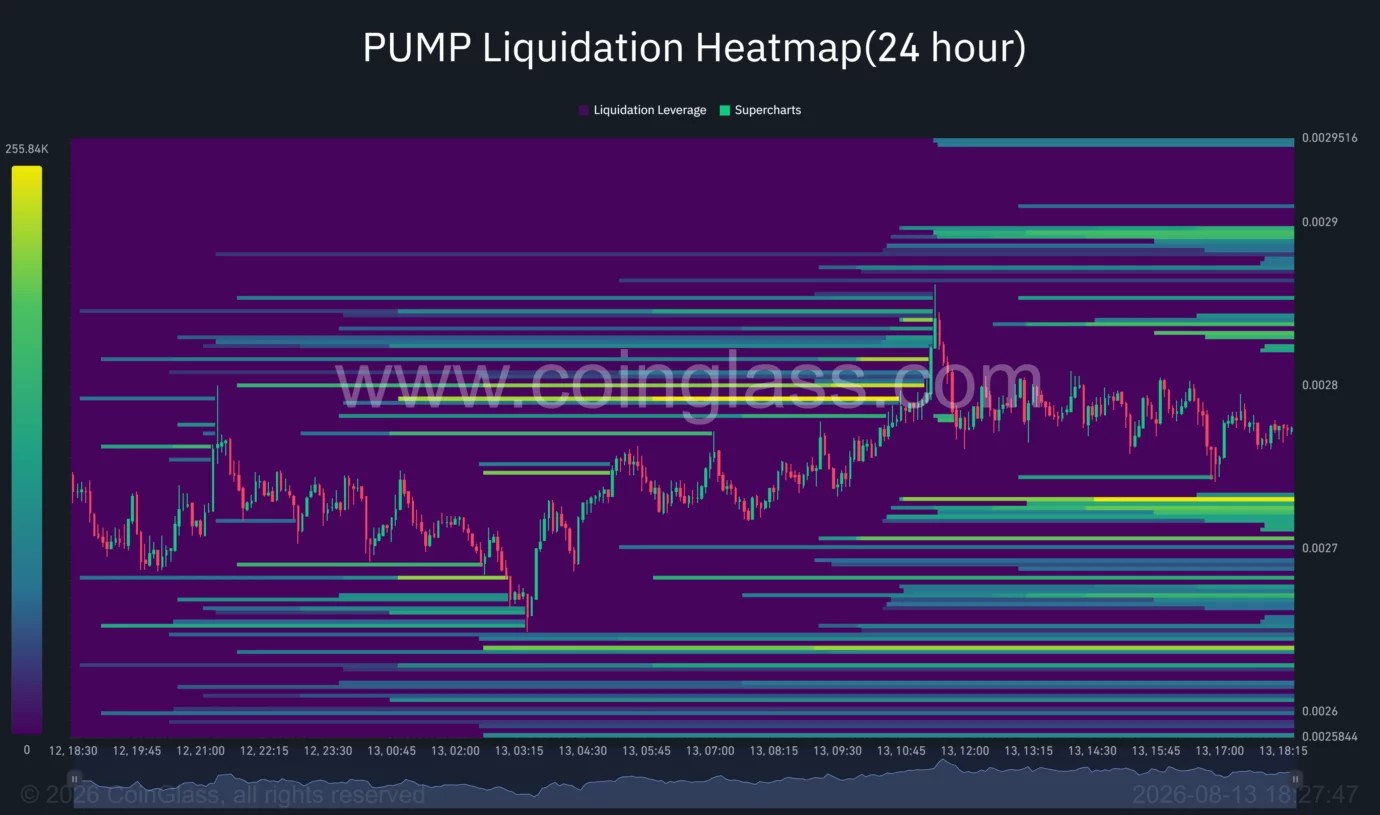
The nearest overhead clusters appear between approximately $0.00282 and $0.00290. A breakthrough at $0.00285 could force short sellers to close positions, adding market buy orders and accelerating a move toward $0.0030.
Larger downside liquidity is visible around $0.00271–$0.00273, with another concentration near $0.00264. Price often moves toward areas containing dense leveraged positions, although a heatmap cannot determine which cluster will be reached first.
A drop below $0.00275 could therefore produce a long-liquidation move toward $0.00270. The stronger bullish structure would only face material damage if sellers push $PUMP below $0.0025.
For U.S. traders, the token’s platform-specific rally is unfolding while the broader crypto market remains cautious following the July inflation report. The Bureau of Labor Statistics released the data on Aug. 12, with annual headline inflation easing to 3.4%.
$PUMP’s relative strength despite restrained movement in Bitcoin suggests that buybacks and platform activity are currently carrying more weight than the wider macro backdrop. The bullish case now depends on a break above $0.0029, while an overbought daily RSI and newly unlocked supply remain the main near-term risks.

 en.cryptonomist.ch
 bsc.news

 ambcrypto.com

 thecryptobasic.com