


 1
1
Between July 27th and August 10th, Aster allocated 99% of daily platform fees to $ASTER buybacks. The project’s latest tokenomics update showed that purchases totaled 2,851,653.28 $ASTER.
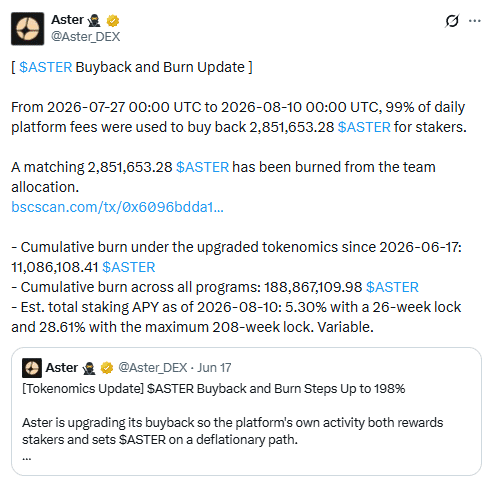
Aster matched those purchases with a 2.85 million $ASTER burn from its team allocation.
Cumulative burns under the new tokenomics surpassed 11,086,108.41 $ASTER since June 17th.
Total burns across all programs reached 188,867,109.98 $ASTER. Continued platform use could link revenue to periodic token removals. At the same time, estimates placed 5.30% to 8.10% of $ASTER’s supply in staking.
However, scarcity alone may not drive price higher. Buyers must still absorb available supply near resistance.
Do exchange outflows support $ASTER?
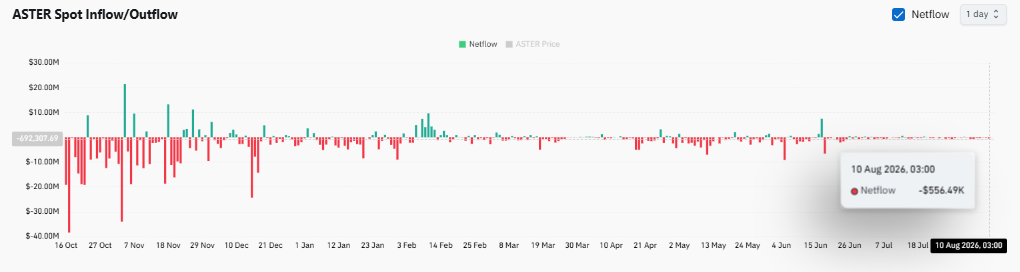
Exchange activity added to the altcoin’s tightening supply conditions. Spot Netflows recorded a negative $556.49K on August 10th.
Negative Spot Netflows meant more $ASTER left exchanges than entered them during the measurement period.
That reduced the tokens immediately available in exchange liquidity. The direction complemented Aster’s buyback and burn program. The chart also showed several larger negative readings across $ASTER’s historical flow profile.
Recent outflows were smaller individually. Even so, their direction reinforced the wider burn and staking narrative. These supply-side forces supported $ASTER’s setup. However, buyers still needed to capitalize on them near resistance.
Can $ASTER reclaim $0.622?
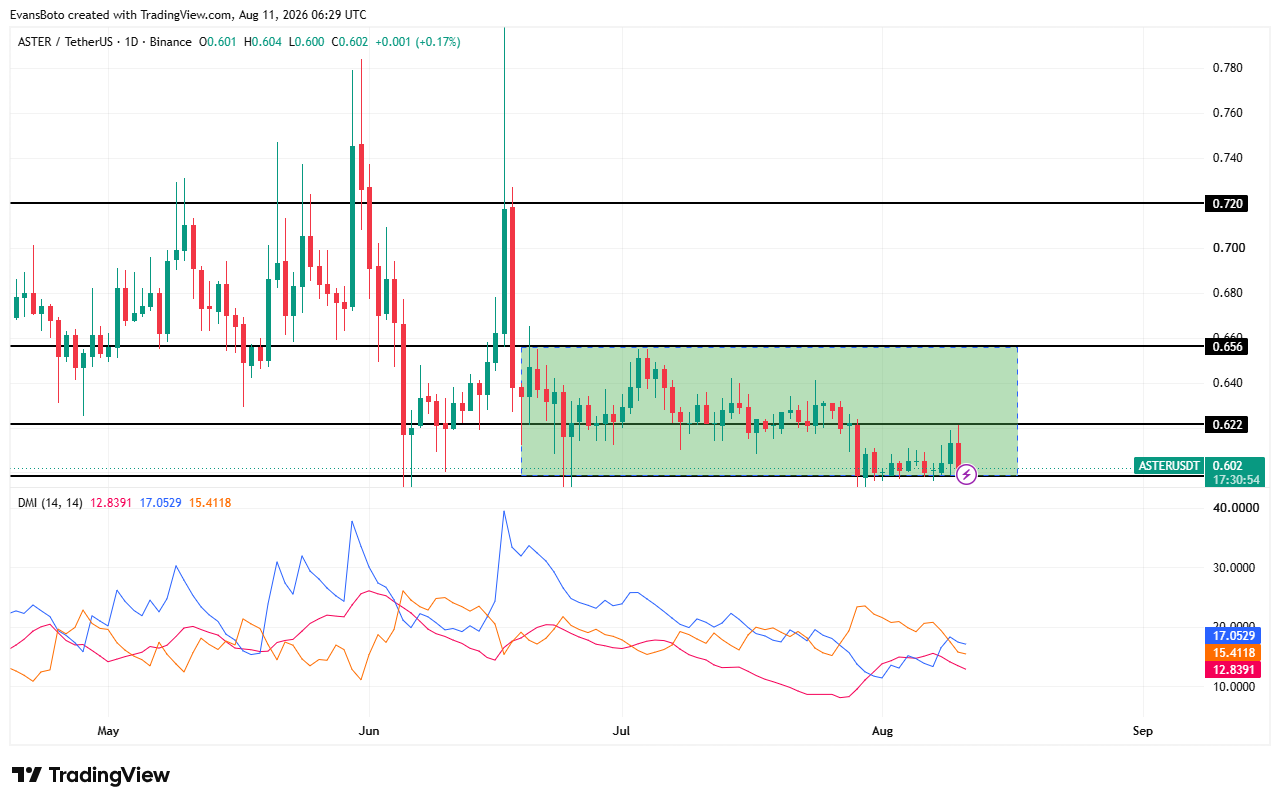
$ASTER traded near $0.602 at press time after breaking below $0.622. The token traded near the range’s lower boundary around $0.600. Its previous range extended from $0.622 to $0.656.
Sellers triggered a breakdown in late July. Since then, the altcoin has moved around $0.600 without establishing a clear recovery path.
That left $0.622 as the first-level buyers needed to reclaim. A recovery above it could reopen the path toward $0.656.
Beyond that, $0.720 remained the larger resistance from June’s structure.
However, the Directional Movement Index showed weak trend conviction. The +DI stood at 17.05, while the -DI reached 15.41. The ADX stood at 12.84, indicating limited trend strength. Buyers held only a slight directional edge.
Supply tightening could support recovery, but $0.622 remained the immediate technical test.
Where could $ASTER move next?
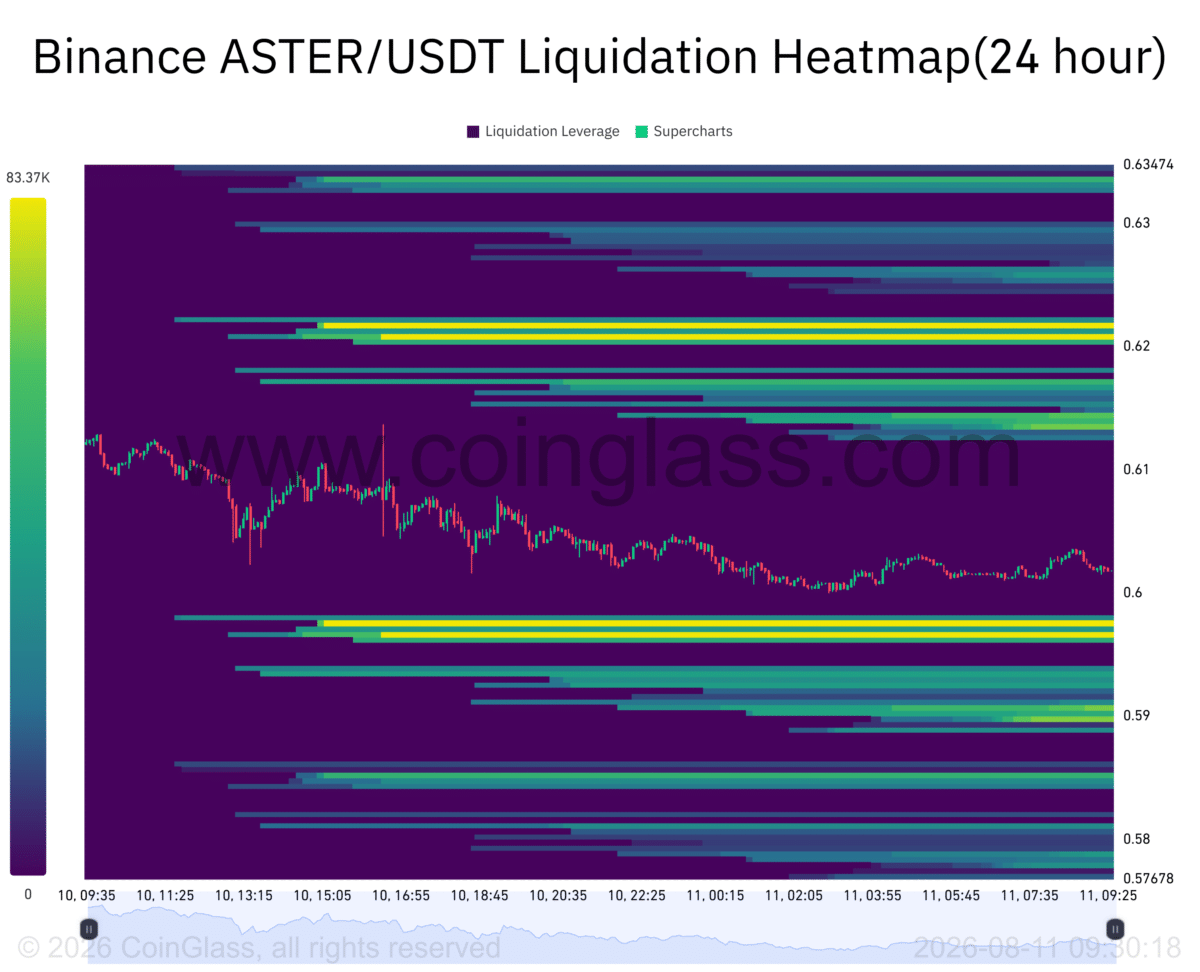
The Liquidation Heatmap placed the altcoin between two prominent liquidity concentrations. The nearest upside liquidity developed around $0.620. That is closely aligned with the $0.622 technical resistance.
Another significant concentration formed around $0.597, below $ASTER’s recent trading range. This left the price trapped between two nearby liquidity pools near $0.600. A sustained rise could draw $ASTER toward $0.620.
If selling resumed, the price could test the $0.597 concentration first. Liquidity also extended below $0.590 and $0.585. Higher concentrations appeared around $0.630 and $0.634. This kept $0.620 to $0.622 as $ASTER’s near-term upside battleground.
Final Summary
- $ASTER buybacks, burns, staking, and negative Spot Netflows reduced the immediately available token supply.
- A reclaim of $0.622 could strengthen $ASTER’s recovery case toward $0.656.

 decrypt.co
