


 2
2
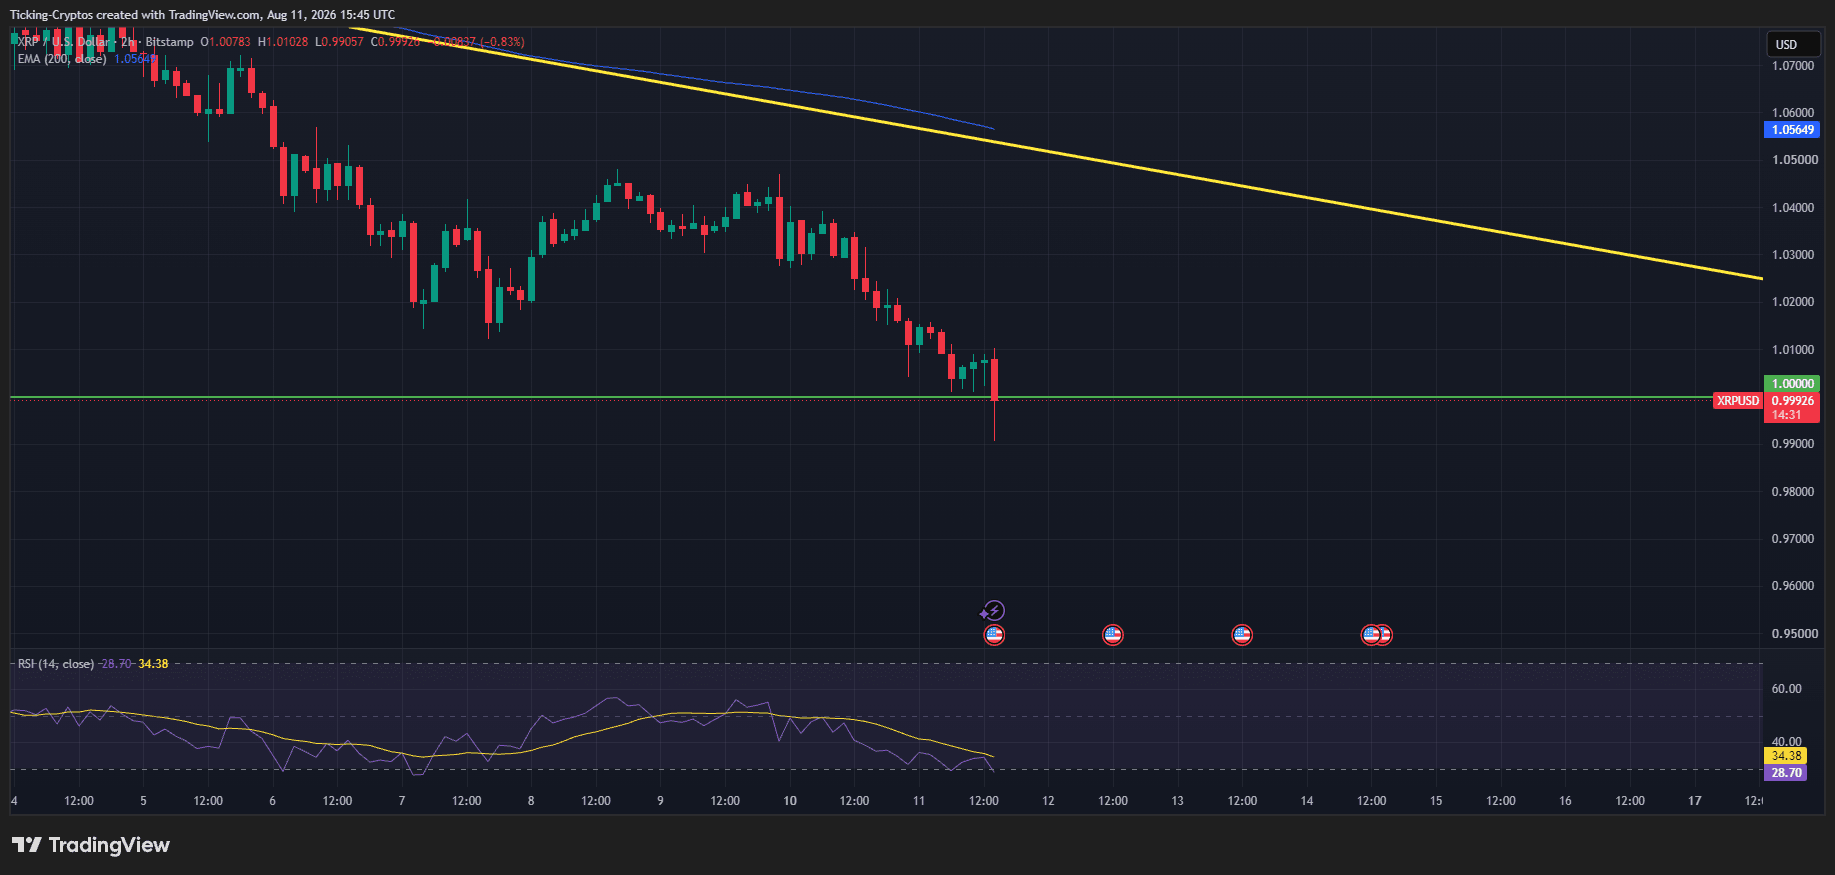
$XRP has broken below $1. On Bitstamp, the two-hour candle to 16:00 UTC on August 11 opened at 1.00783, printed a low of 0.99057 and settled at 0.99926. Against the previous daily close of 1.01108, the token was down roughly 1.15%, with the full intraday swing from the session high near 1.0150 measuring about 2.2%.
The percentage move is modest. The level is not. $XRP had defended $1 for a stretch measured in hundreds of days, and it broke that floor with the 14-period RSI already oversold at 28.70.
Five distinct pressures converged to produce it.
Why did $XRP crash below $1?
In short: ETF demand disappeared, long liquidations forced selling, on-chain activity collapsed, the CLARITY Act catalyst was removed, and macro positioning turned defensive ahead of US inflation data. Each in detail below.
1. ETF demand has evaporated
US spot $XRP funds recorded roughly $1.01 million of inflows across August 3 to 7. Bitcoin and Ether products drew hundreds of millions over the same week. Daily net inflows for $XRP were zero on both August 7 and August 10.
Institutional participation has not merely slowed, it has stopped. Bitwise also cut its $XRP holdings by $3.58 million on August 6. Without a structural bid beneath the market, a psychological level like $1 has nothing holding it up but retail conviction.
2. Long liquidations forced the break
CoinGlass data shows about $8.45 million in $XRP positions liquidated over 24 hours. Of that, $8.25 million were longs, roughly 97.6% of the total. Short liquidations amounted to just $207,044.
That skew is the mechanical explanation for the shape of the move. Leveraged longs positioned above $1 were closed out involuntarily, and each forced sale pushed price into the next cluster of stops. This did not start the decline, but it is what turned a grind into a break.
3. $XRP Ledger activity collapsed 44%
Transactions on the $XRP Ledger fell from around 2.81 million on August 5 to 1.57 million on August 9, a decline of about 44% in four days.
Network usage is the fundamental case for the asset. When throughput halves in under a week, the argument that price is disconnected from utility becomes considerably harder to make.
4. The CLARITY Act catalyst was removed
The Senate entered recess without voting on the CLARITY Act, which had been one of $XRP's principal narrative supports all year. The first procedural vote is now set for September 15 and requires 60 votes to advance.
Prediction markets repriced immediately. Polymarket has been assigning a 65% to 68% probability of $XRP trading at or below $1 during August. A delayed catalyst is functionally a removed catalyst for anyone positioned on a timeline.
5. Macro positioning turned defensive
July CPI lands Wednesday with September Fed hike odds close to a coin flip. Bitcoin is stuck below $65,000, oil is back near $89 after the Strait of Hormuz relief trade unwound, and desks are reducing risk into the print.
Weak assets get sold first ahead of binary macro events. $XRP entered this week as one of the weakest large caps, down 5% to 6% over seven days.
What do the charts show?
Four observations from the two-hour chart.
- The break came on a wick, not a close. The low at 0.99057 sits well beneath the round number, but the close at 0.99926 recovered about 44% of the candle's range. Buyers were active under $1 without being strong enough to reclaim it. The daily close remains unresolved.
- RSI is oversold at 28.70, below the conventional 30 threshold, with its moving average at 34.38. That is a condition rather than a signal. In sustained downtrends RSI holds sub-30 for extended stretches.
- The 200 EMA sits far overhead at 1.05649, roughly 5.4% above price. Every rally since August 4 has failed beneath it.
- The descending trendline is unbroken. Drawn from the August 4 high near 1.075, it now sits around 1.025 and has capped each bounce. The August 7 to 9 recovery topped near 1.045, forming a lower high inside an intact sequence of lower highs and lower lows.
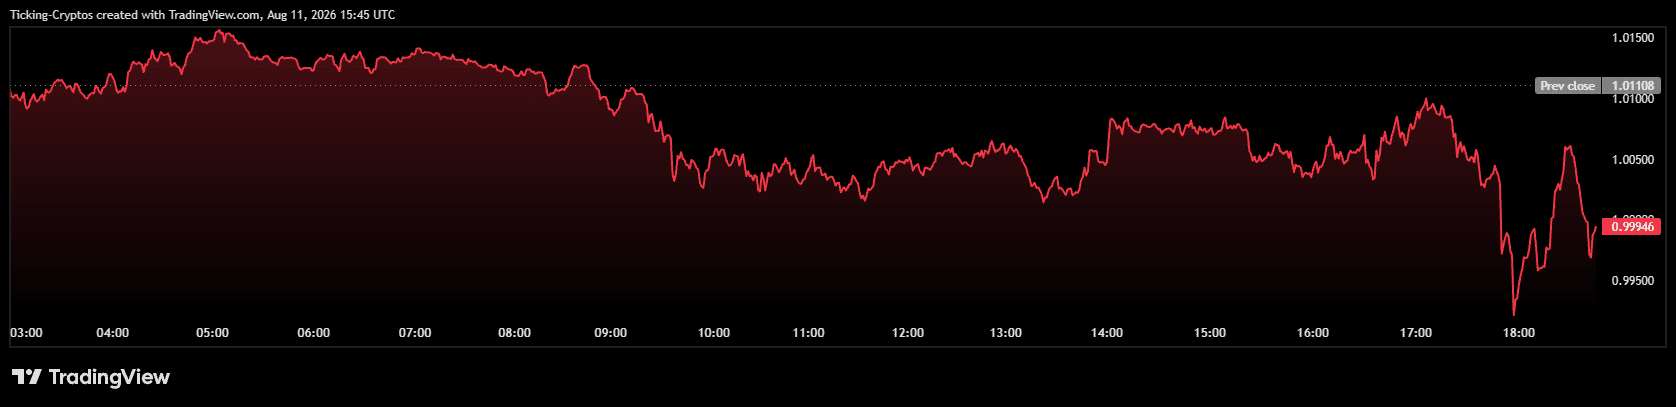
The intraday chart adds a telling detail. Price did not fall in one flush. It ground lower through the European session, chopped between roughly 1.0040 and 1.0070 for hours, rallied back toward 1.0100, and only then dropped sharply to the low. A failed recovery immediately preceding the break is more consistent with resting stop orders beneath $1 than with a single large seller.
What is the counter-argument?
Two data points resist the bearish read.
- Whales added roughly 380 million $XRP over the past week, lifting holdings to approximately 8.1 billion tokens. Large holders have been accumulating into the decline, not distributing.
- Perpetual futures open interest has climbed to 2.74 billion $XRP. Rising open interest against falling price generally indicates fresh short positioning rather than long capitulation. That confirms bearish conviction while simultaneously building the fuel for a squeeze if $1 is reclaimed.
Which levels matter now?
Downside: the immediate zone is $0.99 to $1.00, then a Fibonacci area near $0.97, then $0.94, roughly 5.9% below current price, within a broader $0.94 to $0.86 band.
The weekly chart carries the larger risk. $XRP posted its lowest weekly close in nearly two years on Sunday, snapping the $1.04 shelf that had held every week since November 2024. A clean weekly loss of that level opens the path toward $0.75, roughly 25% lower.
Upside: $1.036 is the first reclaim that would repair short-term structure, about 3.7% above price, and the descending trendline near $1.025 must break first. The 200 EMA at $1.05649 is the level that would mark a genuine trend change.

 finbold.com

 ambcrypto.com

 news.bitcoin.com
 thecryptobasic.com