



 8
8
Bitcoin, Ethereum, and $XRP have entered pivotal trading zones as investors assess whether recent price trends will continue or reverse. Bitcoin continues to hold above an important support cluster despite losing momentum near a key Fibonacci level.
Meanwhile, Ethereum maintains a stronger technical position after recovering above several moving averages, giving buyers confidence in the current trend. $XRP, however, remains under pressure as bearish momentum dominates the chart.
Bitcoin Price Prediction: BTC Holds Firm Above Major Support
Bitcoin trades near $64,257 after failing to extend gains above the 0.786 Fibonacci retracement at $64,942. However, the pullback has not damaged the broader structure. Instead, the price continues to sit above a tightly packed group of the 20, 50, 100, and 200 exponential moving averages between $63,995 and $64,192.
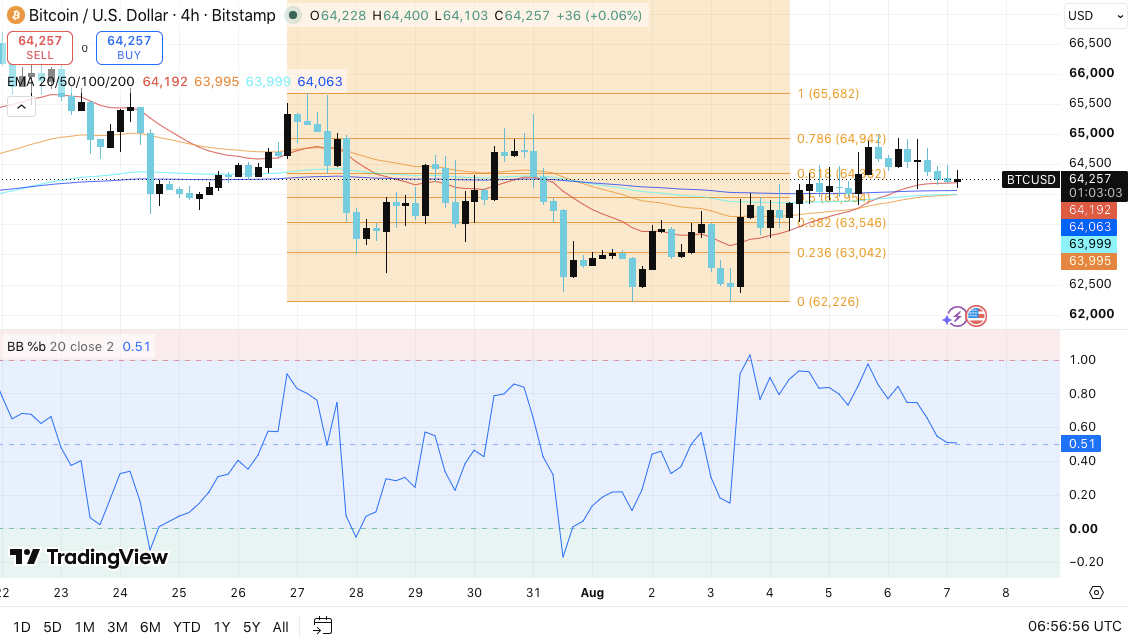
This technical convergence often signals an important turning point. Additionally, the neutral Bollinger Band %B reading shows momentum has cooled without shifting strongly bearish. Buyers continue defending the $64,000 region despite profit-taking across the market.
Related: Meme Coins Price Prediction: Dogecoin (DOGE), Shiba Inu (SHIB), MemeCore (M)
If Bitcoin breaks above $64,942, bulls could challenge the swing high near $65,682. However, losing support at $63,954 may increase selling pressure and expose $63,546 before the market tests $63,042.
Ethereum Price Prediction: ETH Keeps Bullish Structure Intact
Ethereum continues to outperform after recovering from its recent swing low near $1,821. The asset now trades around $1,903 while holding above the 20, 50, 100, and 200 EMAs. Moreover, the successful move above the 0.382 Fibonacci retracement has strengthened confidence among short-term buyers.
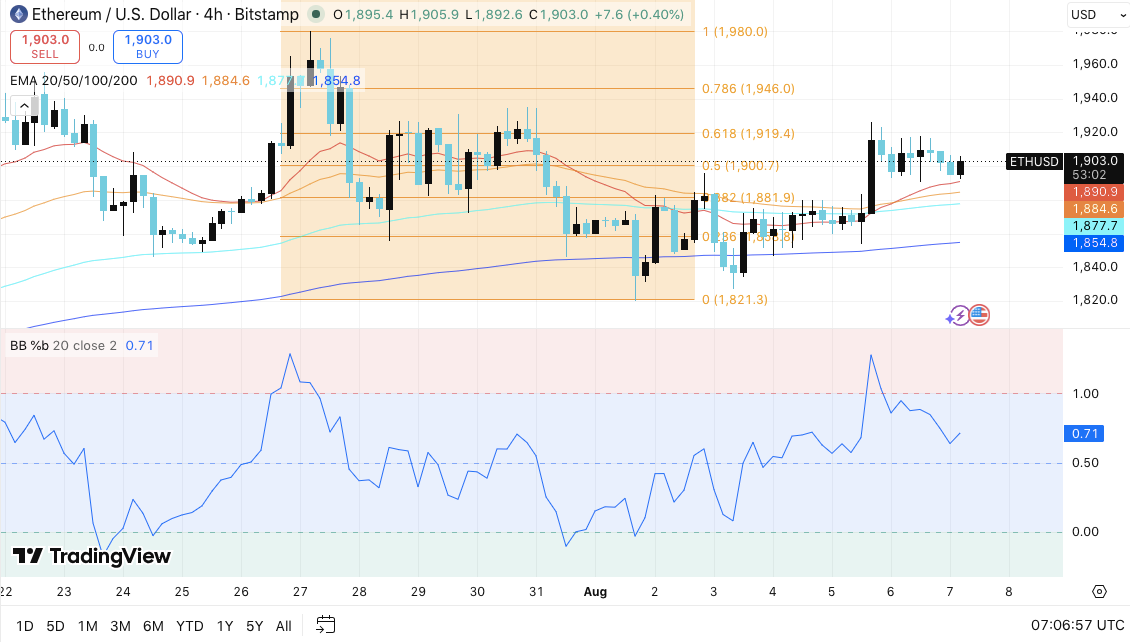
The $1,900 area now serves as immediate support. Besides, the Bollinger Band indicator suggests bullish momentum still has room to expand before reaching overbought conditions.
A decisive move above $1,914 could encourage another rally toward $1,946. Furthermore, clearing $1,980 would confirm stronger upside momentum. On the downside, losing the $1,890 support zone could trigger a retreat toward $1,877 and the 200 EMA near $1,855.
$XRP Price Prediction: $XRP Searches for Stability After Recent Weakness
$XRP remains the weakest performer among the three assets. The token trades near $1.025 while staying below every major short-term moving average. Consequently, the prevailing downtrend remains intact as sellers continue creating lower highs and lower lows.
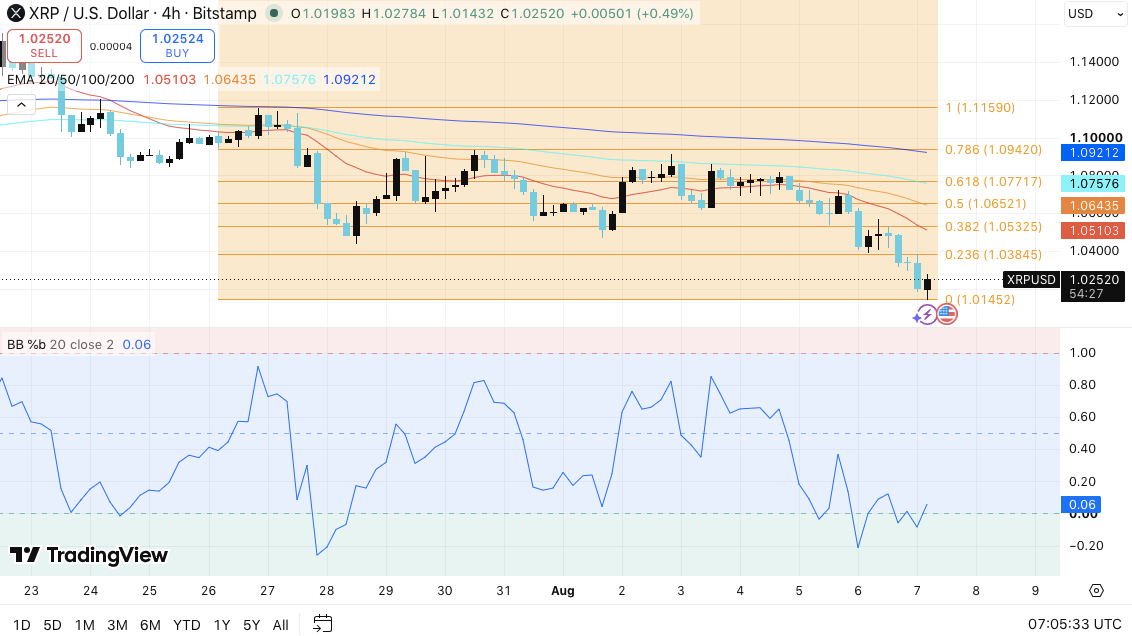
The Bollinger Band %B reading indicates oversold conditions, raising the possibility of a short-term rebound. However, buyers must reclaim resistance between $1.053 and $1.065 before sentiment improves meaningfully.
Failure to defend the immediate support at $1.0145 could send $XRP toward the psychological $1.00 level. Additionally, a break below that mark may expose the $0.985 to $0.970 support region.

 coincodex.com
 coinpedia.org
 finbold.com
