


 2
2
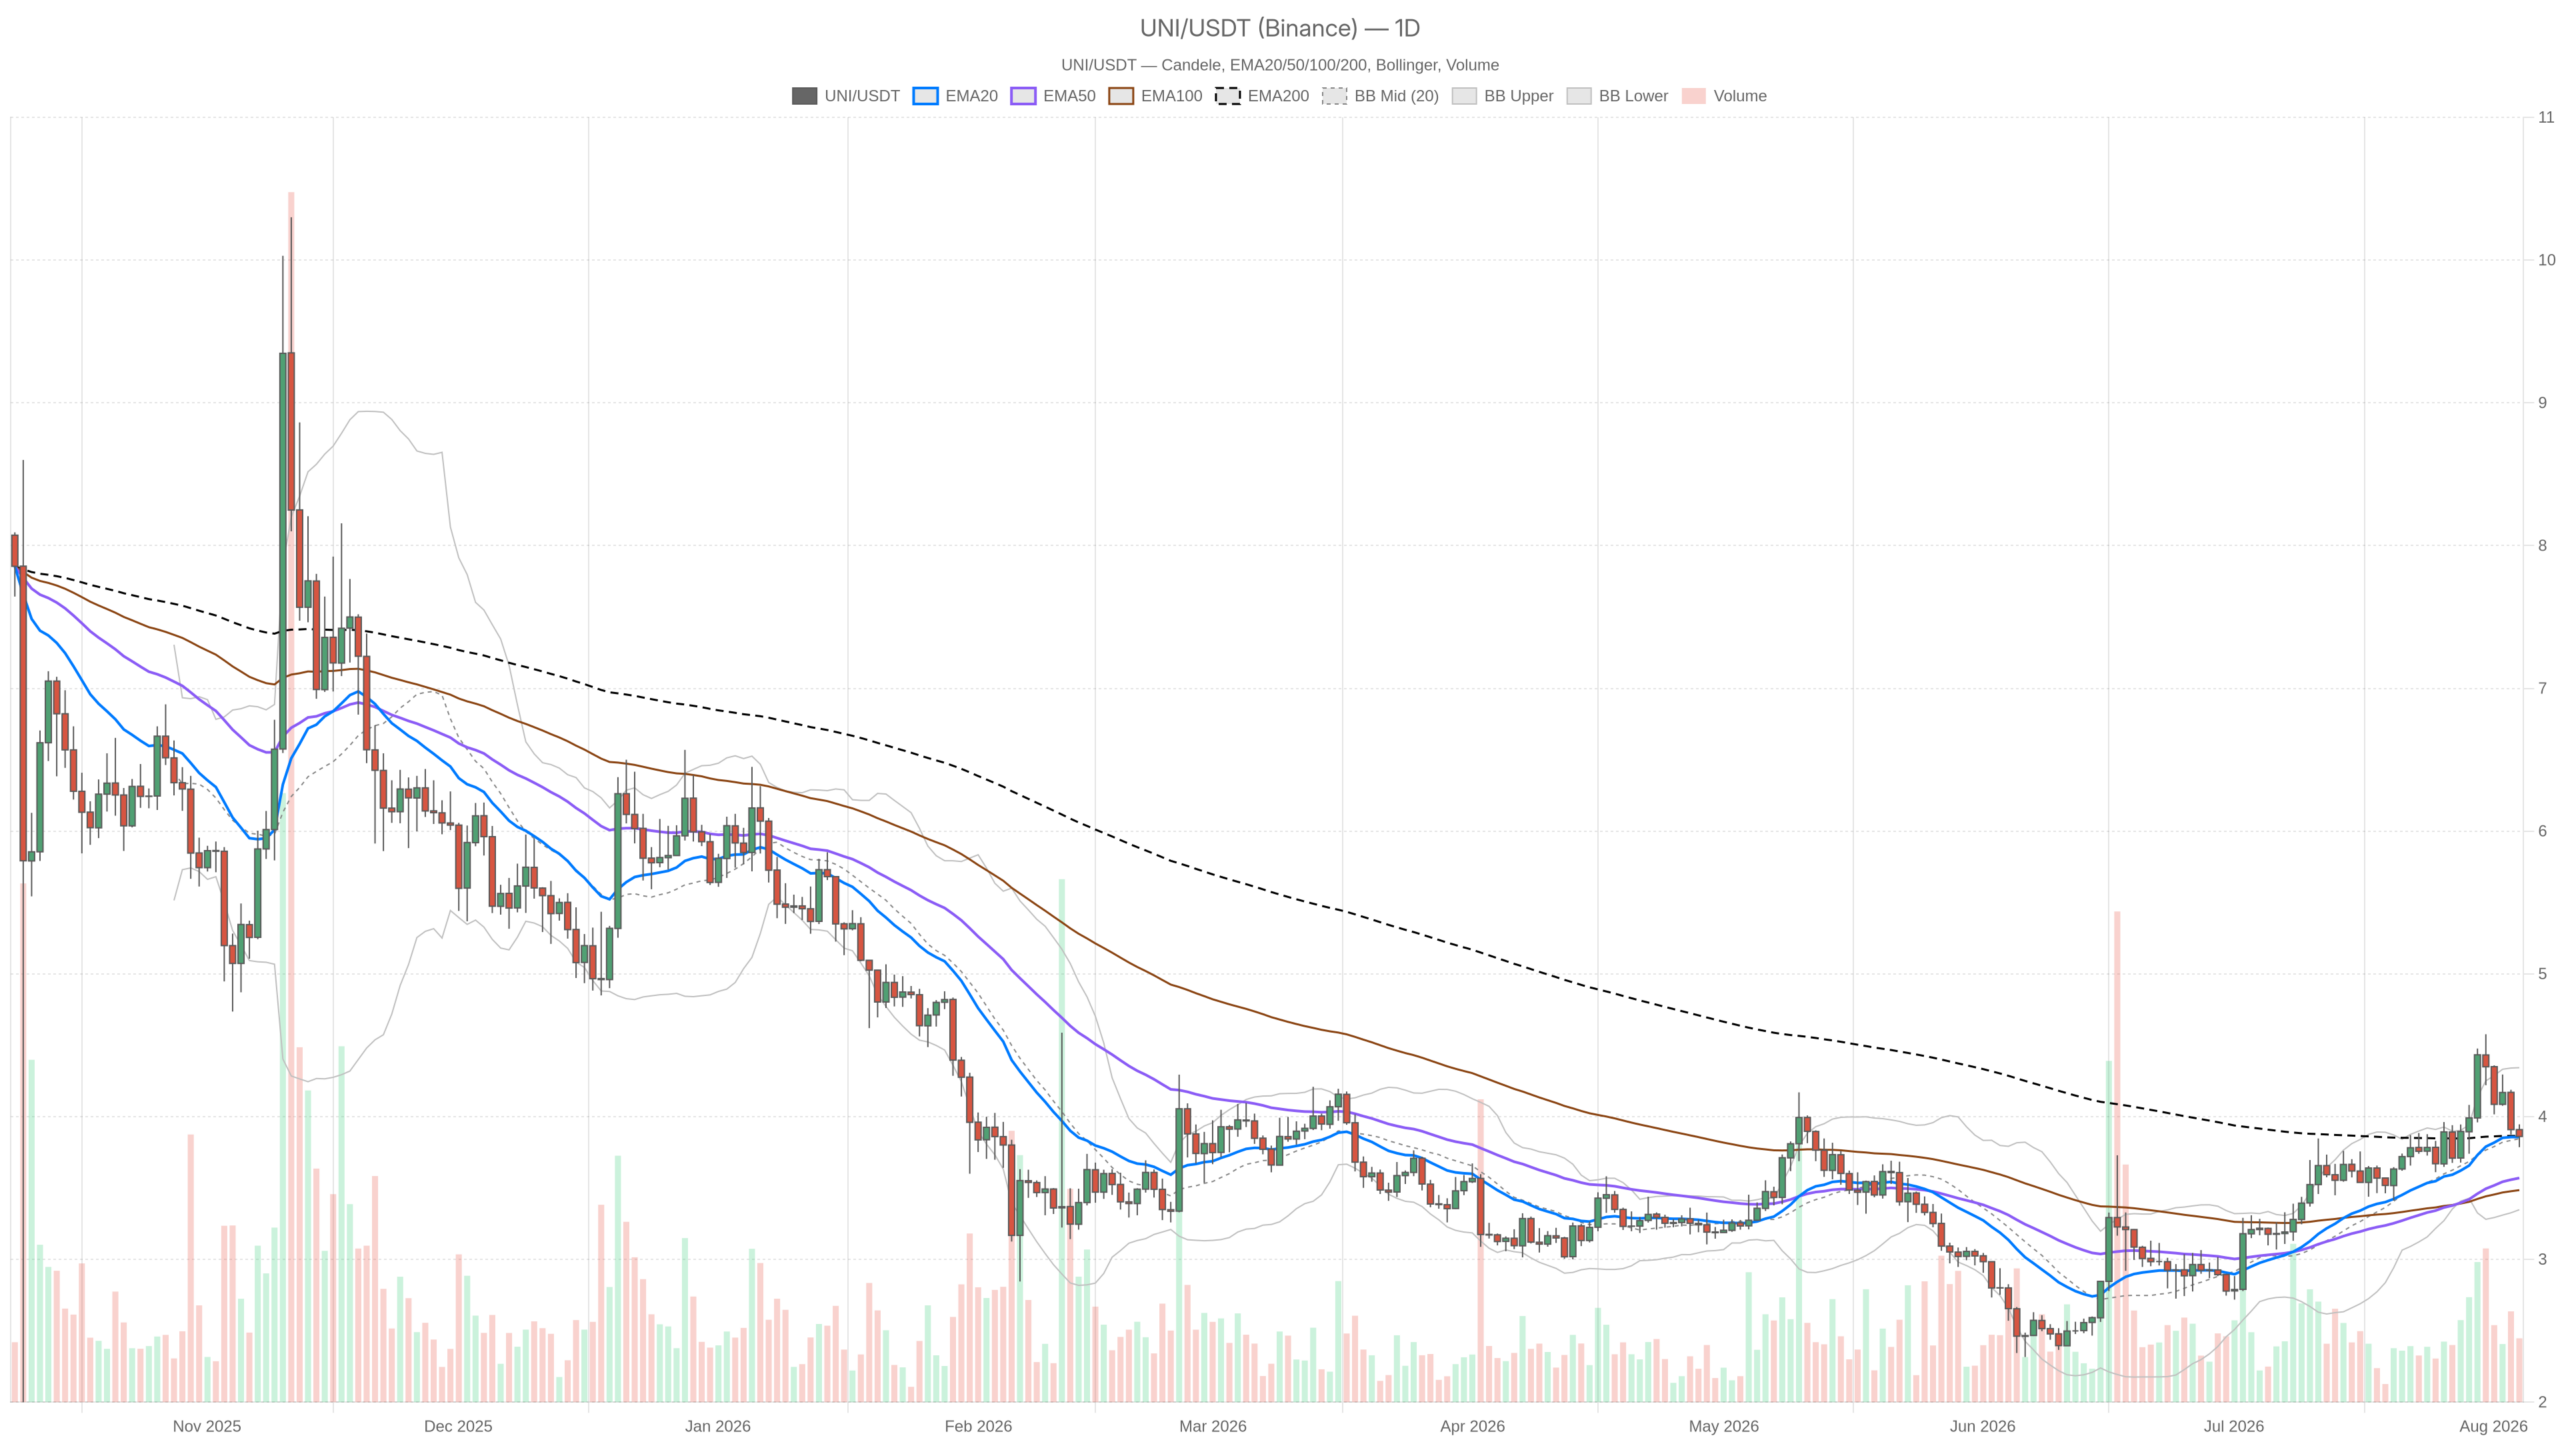
As of August 4, 2026, the Uniswap crypto token $UNI closed at $3.86, sitting precisely on its daily pivot point and wedged between its 20-day EMA and 200-day EMA. That kind of compression rarely lasts and signals building energy for a decisive move.
Key takeaways
- $UNI closed at $3.86, pinned to its daily pivot point between the 20-day EMA ($3.86) and 200-day EMA ($3.87)
- The Fear & Greed Index reads 25, signaling Extreme Fear across the broader crypto market
- Daily RSI14 at 52.73 remains neutral, but the 1-hour chart is outright bearish
- Uniswap V3 fees surged 54.53% in a single day, pointing to bursts of on-chain activity
- Daily ATR of $0.27 with Bollinger Bands from $3.35 to $4.34 signals elevated volatility ahead
Daily Chart: Neutral, But Not Calm
The daily timeframe is officially labeled neutral, and the indicators back that up on the surface. RSI14 sits at 52.73 — dead center, with no overbought or oversold pressure either way. However, the EMA stack deserves a closer look. The 20-day ($3.86) and 200-day ($3.87) are almost overlapping, while the 50-day EMA trails well below at $3.57.
That gap between the 50 and the other two averages is a leftover signature of a prior uptrend that has since flattened out. Price is now testing whether that older trend still has any pull. Meanwhile, MACD adds a subtle warning: the MACD line at 0.18 sits just under its signal line at 0.20, producing a small negative histogram of -0.02.
It is not a dramatic bearish cross, but it signals a loss of upward momentum at a moment when the trend needed to reassert itself rather than stall. Bollinger Bands are wide — mid at $3.85, upper at $4.34, lower at $3.35 — and the ATR14 of $0.27 confirms real volatility remains baked into this asset. The daily pivot cluster is tight: pivot at $3.86, resistance R1 at $3.94, support S1 at $3.78. The token is trading on the knife’s edge of that pivot, which is why the next daily close matters more than usual.
The 1-Hour Chart Tells a Weaker Story
Where the daily chart hedges, the 1-hour chart picks a side — labeled outright bearish. Price at $3.86 is trading below all three EMAs, and the stack itself is bearishly aligned: EMA20 at $3.88, EMA50 at $3.95, EMA200 at $4.02. That is a clean downward staircase, and it is the strongest single piece of evidence that short-term sellers currently have the upper hand.
RSI14 on the 1-hour sits at 42.11, not oversold but clearly leaning weak. MACD is negative — line at -0.03, signal at -0.04 — though the histogram has ticked up to +0.01, an early hint that downside momentum may be losing steam without yet confirming a reversal. Moreover, Bollinger Bands have tightened sharply here: mid at $3.87, upper at $3.92, lower at $3.82, with ATR14 down to just $0.04. That is a market compressing into a narrow range after a pullback, which often precedes a volatility release in one direction or the other.
15-Minute Execution Context
On the 15-minute chart, price at $3.85 sits almost exactly on the lower Bollinger Band ($3.85) and right at the S1 pivot support ($3.85). EMA20 and EMA50 both converge at $3.87 above current price. RSI14 at 44.18 and a flat MACD — line at 0.00, signal at 0.01, histogram at 0.00 — show no real momentum in either direction at this granularity. For anyone using this timeframe for entries, the read is simple: there is no confirmed trigger yet, just a level being tested.
Bullish Case for $UNI
The bullish path requires $UNI to hold above the daily S1 support at $3.78 and, ideally, defend the 200-day EMA at $3.87 on a closing basis. A reclaim of the daily R1 at $3.94, paired with price pushing back above the 1-hour EMA20 ($3.88) and EMA50 ($3.95), would flip the short-term structure from bearish to constructive. That would suggest the pullback on lower timeframes was just noise inside a larger range.
Confirmation would come from the 1-hour RSI moving back above 50 and the MACD histogram turning positive rather than hovering near zero. This scenario is invalidated the moment daily price closes decisively below $3.78 with the 200-day EMA also breaking — at that point, the bullish read loses its structural anchor.
Bearish Case for $UNI
The bearish case is already partially confirmed by the 1-hour regime. If $UNI loses the daily S1 at $3.78 and closes below the 200-day EMA ($3.87), the path opens toward a deeper test — potentially toward the lower Bollinger Band region near $3.35 on the daily chart, given the current ATR of $0.27. As long as price stays below the 1-hour EMA200 at $4.02 and the EMA stack remains bearishly aligned, sellers retain control on the shorter timeframes.
That holds true even if the daily chart is technically neutral. This scenario is invalidated by a reclaim of $3.94 — daily R1 — combined with a 1-hour close back above $3.95. That would undercut the bearish EMA alignment currently driving the hourly regime.
On-Chain Data Signals
Away from price, the protocol’s own activity sends a more energetic signal. According to DefiLlama data, Uniswap V3 fees jumped 54.53% in a single day, even though they are still down 38.62% over the past 7 days and up 70.5% over the past 30 days. Uniswap V4 shows a similar shape: fees up 37.02% on the day, down 24.35% over the week, but up 11.65% over the month.
That is a pattern of sharp short-term spikes inside a choppier weekly trend — activity arrives in bursts rather than a steady climb. This tracks with a price chart that is compressing rather than trending. It serves as a reminder that trading volume on $UNI markets can pick up quickly even while the token’s own price action looks indecisive.
Positioning, Risk and What Comes Next
Right now Uniswap crypto is caught between a daily chart that refuses to commit and an hourly chart that is already leaning bearish. That disagreement is the story, not a footnote to it. Traders leaning on the daily neutral read while ignoring the hourly downtrend are taking on more directional risk than the neutral label suggests.
The Extreme Fear reading of 25 across the broader market adds another layer. Sentiment this stretched can either precede capitulation-style flushes or mark the early stages of exhaustion. There is no indicator in this dataset that settles which one is coming. Moreover, the broader crypto market cap sits at $2.276 trillion, up a modest 0.62% over 24 hours, while Bitcoin dominance holds at 56.57%, according to CoinGecko data. That combination — a barely-green total market against a genuinely scared sentiment reading — tells you capital is cautious and altcoins like $UNI are having to earn every bit of directional conviction.
Volatility remains real underneath the quiet surface. The daily ATR of $0.27 and the wide Bollinger range from $3.35 to $4.34 make clear that a breakout, whichever direction it takes, will not be a small move. None of this is a signal to act in either direction. It is simply the honest state of a market sitting exactly on its own pivot, waiting to show its hand.
FAQ
What is $UNI’s current price and where is it trading relative to key levels?
As of August 4, 2026, $UNI closed at $3.86, sitting directly on its daily pivot point. It is wedged between the 20-day EMA at $3.86 and the 200-day EMA at $3.87, with daily support at S1 ($3.78) and resistance at R1 ($3.94).
Is the $UNI chart bullish or bearish right now?
The daily chart is officially neutral with RSI14 at 52.73, but the 1-hour chart is outright bearish. Price trades below all three hourly EMAs in a clean downward staircase, which gives short-term sellers the upper hand despite the daily timeframe’s indecision.
What does the Fear & Greed Index at 25 mean for $UNI?
The Extreme Fear reading of 25 across the broader crypto market signals that capital is cautious and risk appetite is low. Sentiment this stretched can either precede capitulation-style flushes or mark the early stages of exhaustion, with no clear signal yet as to which scenario will play out.
Disclaimer: This article is for informational purposes only and does not constitute financial advice, an investment recommendation, or a solicitation to buy or sell any financial instrument or cryptocurrency. The analysis provided is not indicative of future results. Investing in crypto assets and financial markets carries a high risk of capital loss. Always do your own research (DYOR) and consult a qualified financial advisor before making any decision.
Article produced with the assistance of artificial intelligence and reviewed by the editorial team.

 en.bitcoinsistemi.com
 bitcoinmagazine.com
 crypto-economy.com
 coindesk.com