


 2
2
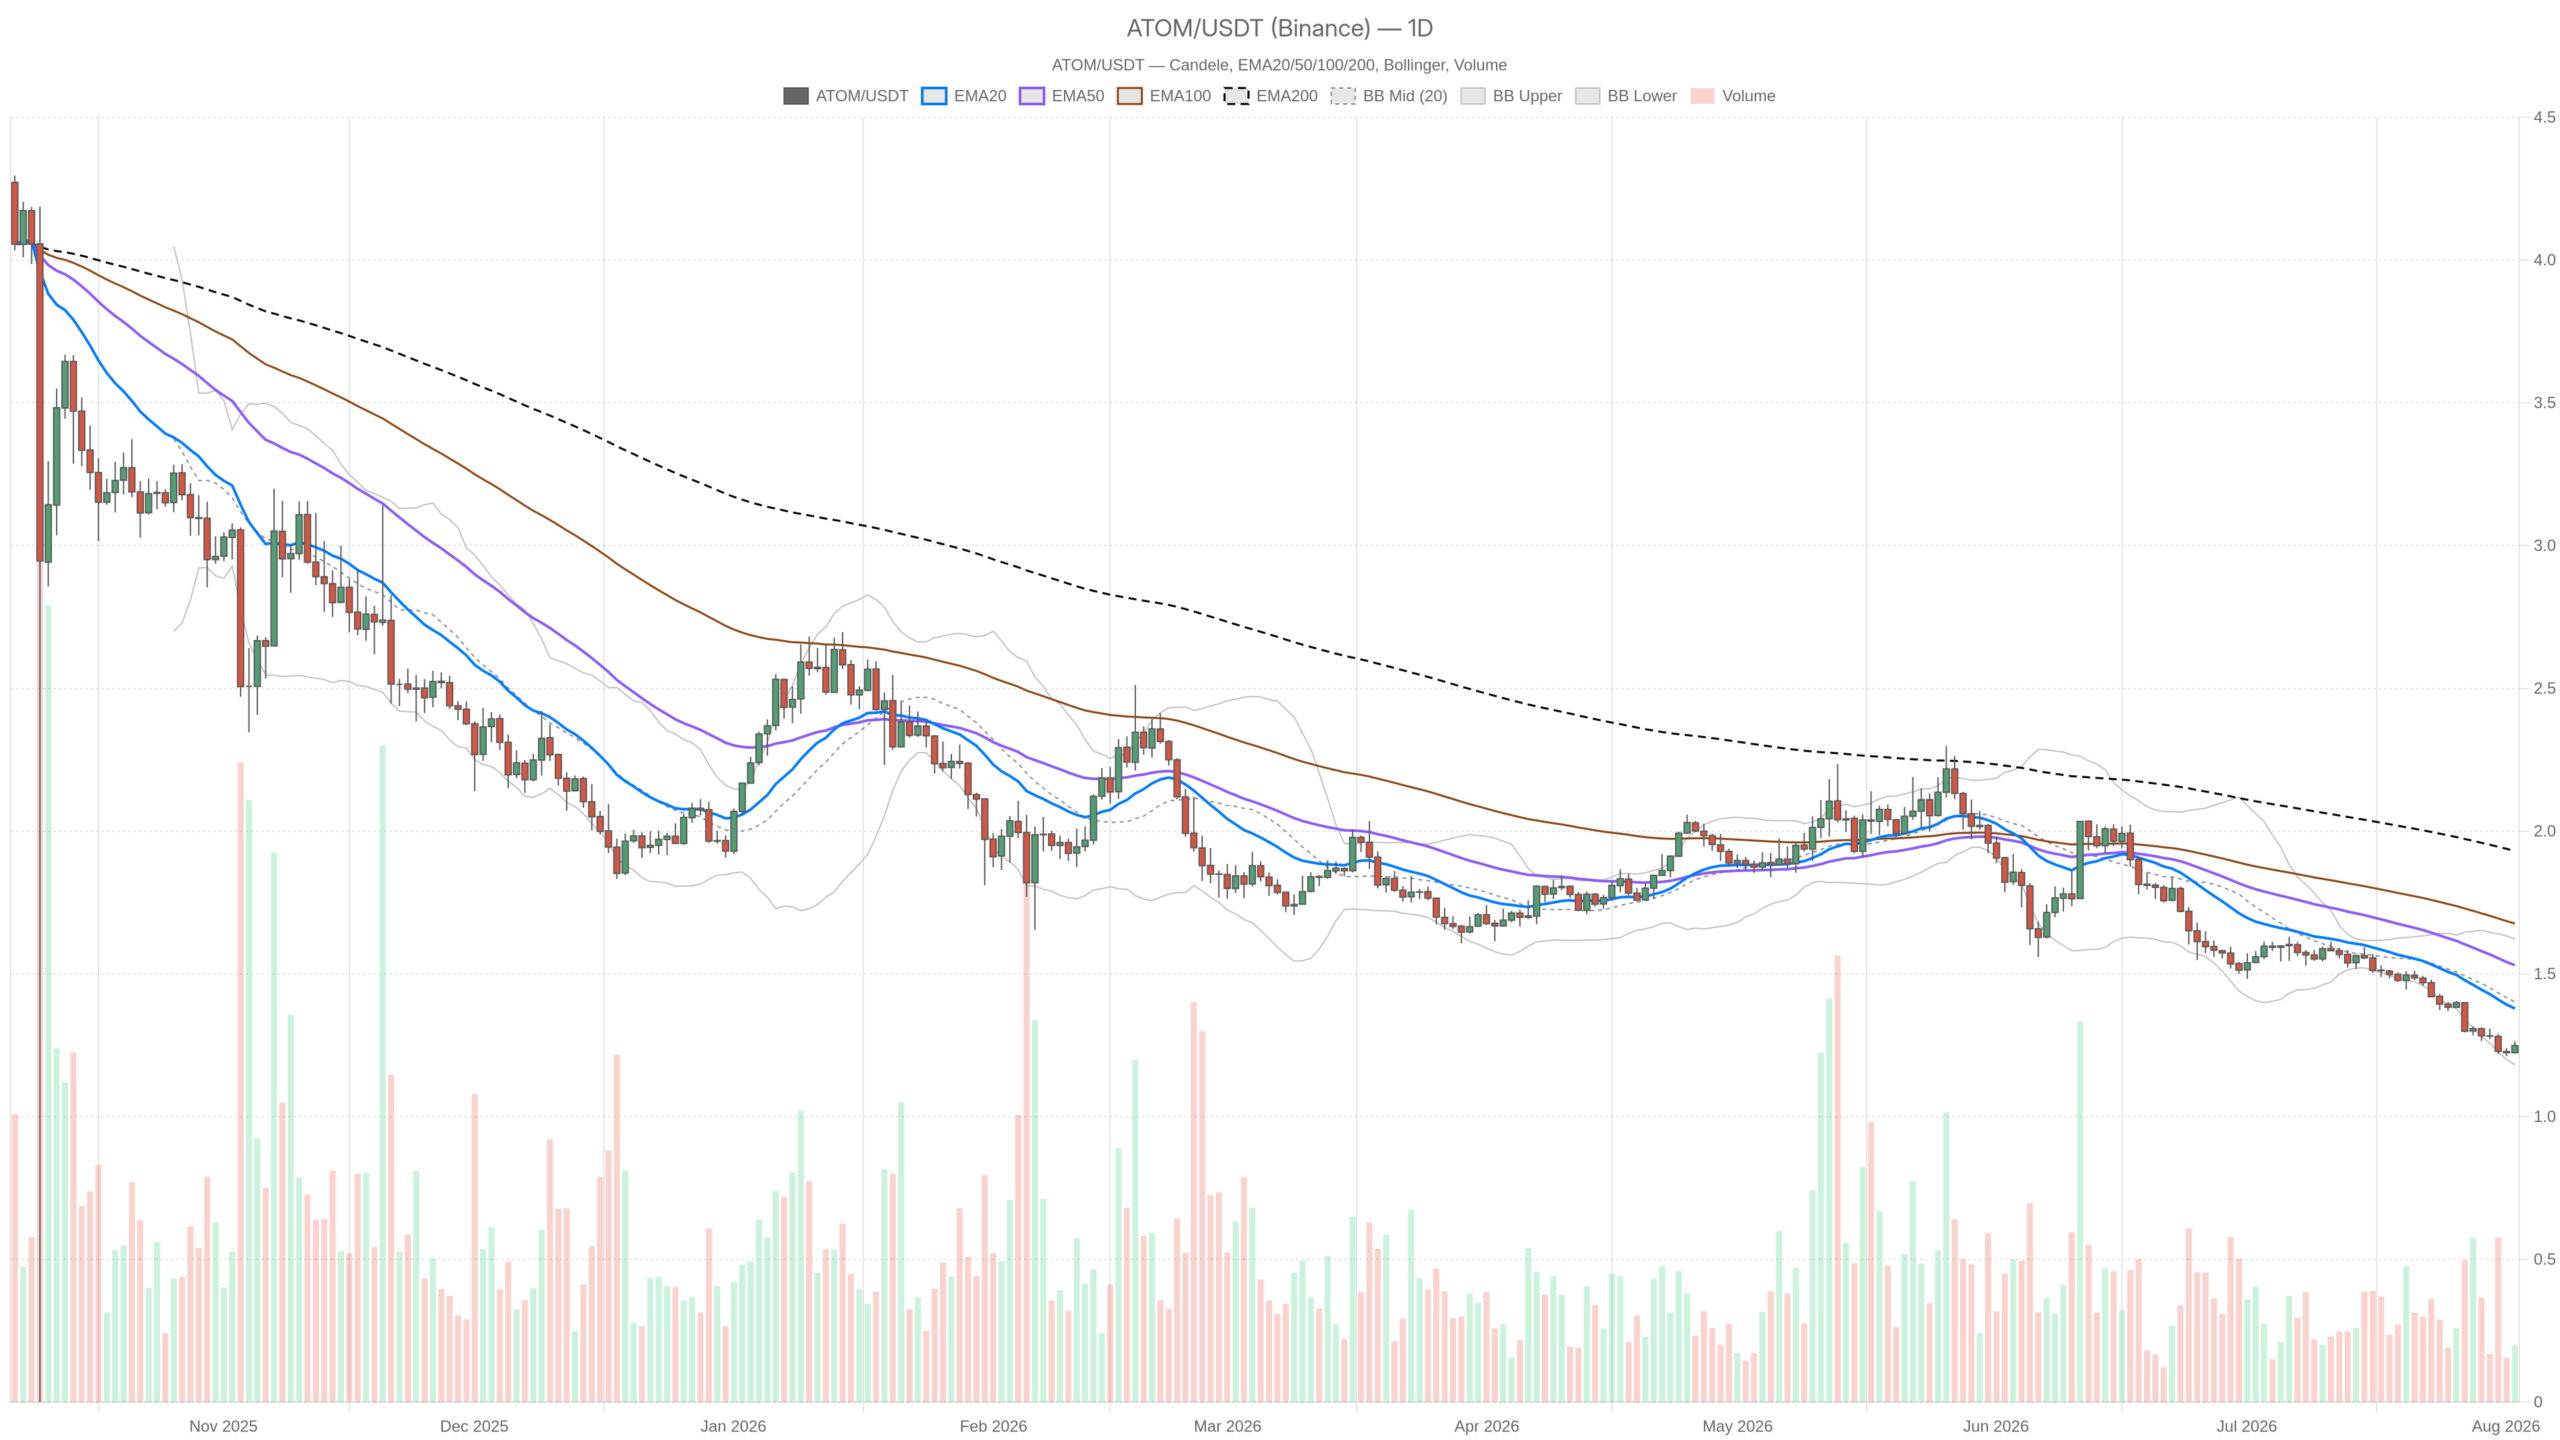
As of August 2, 2026, $ATOM trades at $1.25 against $USDT, with the daily trend pointing firmly downward. The Cosmos Hub crypto asset sits in technical limbo — higher timeframes are broken, yet short-term price action has paused, creating a deceptive calm that separates the two narratives.
Key takeaways
- $ATOM trades at $1.25, below EMA20 ($1.38), EMA50 ($1.53), and EMA200 ($1.93) — a fully bearish EMA stack.
- Daily RSI14 sits at 24.16, deep in oversold territory, while MACD remains negative with no bullish crossover in sight.
- The Fear & Greed Index reads 27 and $BTC dominance holds at 56.2%, signaling risk-off conditions that have historically weighed on altcoins.
- Lower Bollinger Band at $1.18 serves as the next logical bearish target; bulls need to reclaim $1.38 to shift momentum.
- Short-term timeframes show compression and neutrality, not reversal — 1H regime is flat and 15m Bollinger Bands are extremely tight.
Daily Chart Tells a Bearish Story
The daily chart structure is unambiguously bearish — $ATOM at $1.25 trades below every major EMA in a fully stacked descending order, confirming a clean downtrend signature that leaves little room for bullish interpretation. Price sits below the EMA20 at $1.38, the EMA50 at $1.53, and the EMA200 at $1.93. That is about as textbook a bearish EMA stack as one will see on a chart, and the system itself flags the daily regime accordingly.
The RSI14 on the daily sits at 24.16, deep into oversold territory. On its own, that number often gets misread as an automatic buy-the-dip signal, but in a strong downtrend oversold readings can persist for a long time — momentum being stretched does not mean it is about to reverse. The daily MACD confirms sellers still have the upper hand: the MACD line at -0.09 remains below the signal line at -0.08, while the histogram is negative at -0.01. The small reading, however, suggests bearish momentum is decelerating rather than accelerating.
The Bollinger Bands reinforce the picture: mid-band at $1.40, upper band at $1.62, and lower band at $1.18. Current price near $1.25 is hugging the lower half of the range, consistent with persistent selling pressure that has not yet earned its way back toward the middle. ATR14 on the daily reads 0.05, representing a meaningful percentage of the current price — daily swings of several cents in either direction should be expected.
The 1H and 15m Picture: A Pause, Not a Reversal
Lower timeframes show a market that has stopped falling but has not begun to reverse — the 1H regime is neutral with overlapping EMAs, while the 15m chart reveals tight Bollinger Bands signaling compression rather than any emerging directional bias. On the 1-hour chart, EMA20 ($1.24), EMA50 ($1.24), and price ($1.25) are essentially overlapping, with only the EMA200 ($1.30) sitting meaningfully above. RSI14 on the 1H reads 55.89 — mildly bullish, nowhere near overbought, just modestly above the midpoint.
The 1H MACD line (0.01) sits fractionally above its signal (0.00), with a flat histogram near zero. None of this signals strong bullish conviction; it is more accurately described as the absence of selling pressure over recent hours rather than genuine buying interest. Meanwhile, the 15-minute timeframe echoes that flatness: EMA20, EMA50, and price cluster around $1.24–$1.25, RSI14 sits at 44.25, and MACD is essentially flat at zero. Bollinger Bands on the 15m are extremely tight — mid at $1.26, upper at $1.26, lower at $1.25 — which typically signals a market waiting for a trigger rather than one already in motion.
Bullish Scenario for $ATOM
Bulls need $ATOM to reclaim the daily EMA20 near $1.38 with conviction and push RSI14 back above 40–50 to show sellers are genuinely losing control rather than merely pausing. A break above the daily R1 pivot at $1.27 would serve as an early tell that short-term buyers are testing resistance. What would invalidate this bullish case quickly is a failure to hold above the $1.23 S1 support — a break below that level would suggest the current pause was nothing more than consolidation before the downtrend resumes toward the lower Bollinger Band.
Bearish Scenario for $ATOM
The bearish case remains the path of least resistance — failure to reclaim the EMA20/EMA50 cluster opens the door to a retest of the daily lower Bollinger Band near $1.18, with the distant EMA200 at $1.93 underscoring just how far $ATOM must travel to approach a neutral daily structure again. This scenario would be invalidated if the 1H neutral regime evolves into a genuine bullish shift — specifically, sustained closes above $1.27 with rising volume and RSI14 pushing convincingly past 60 on the hourly, which would hint at accumulation rather than a temporary bounce. Until that happens, the higher-timeframe downtrend retains authority over the lower-timeframe calm.
Positioning and Risk
Traders should treat the current short-term calm as exactly that — a pause, not confirmation — and size positions for the likelihood that both $1.23 support and $1.27 resistance get tested and rejected multiple times before any real directional move materializes. Right now, Cosmos Hub crypto price action is caught between a daily downtrend that has not been disproven and a short-term range that has produced no clear breakout in either direction. The Fear & Greed reading of 27 and $BTC dominance above 56% both point to a market that is not in a risk-on mood, which historically has not been kind to altcoins attempting a recovery.
ATR readings suggest volatility remains elevated relative to price, meaning moves of several percentage points can happen quickly and without much warning. Until price reclaims the EMA20/EMA50 zone on the daily timeframe, every bounce is arguably still a lower-timeframe phenomenon inside a bigger downtrend — and anyone positioning around this asset should factor in that oversold readings can stay oversold for longer than feels comfortable in a market this cautious.
FAQ
Is $ATOM’s daily RSI at 24.16 a reliable buy signal?
Not on its own. While an RSI of 24.16 indicates deeply oversold conditions, such readings can persist throughout a strong downtrend without triggering a reversal. The broader EMA structure and negative MACD reinforce that sellers remain in control, so an oversold RSI should be viewed as a measure of how extended the trend has become rather than a standalone entry signal.
What level must $ATOM reclaim to shift the daily bias?
$ATOM needs to reclaim the daily EMA20 near $1.38 with conviction, ideally accompanied by a bullish MACD histogram crossover and RSI14 climbing back above 40–50. A break above the $1.27 R1 pivot would serve as an early indication that buyers are testing resistance in earnest.
Where is the next bearish target if $ATOM continues falling?
The daily lower Bollinger Band near $1.18 represents the next logical downside target, with the daily S1 support at $1.23 acting as an intermediate level to watch on the way down.
How does the macro environment affect $ATOM’s outlook?
With the Fear & Greed Index at 27 and $BTC dominance holding above 56%, risk appetite across the crypto market remains subdued. In this environment, capital tends to concentrate in Bitcoin rather than flowing into altcoins like $ATOM, making a sustained recovery more difficult until macro sentiment improves.
Disclaimer: This article is for informational purposes only and does not constitute financial advice, an investment recommendation, or a solicitation to buy or sell any financial instrument or cryptocurrency. The analysis provided is not indicative of future results. Investing in crypto assets and financial markets carries a high risk of capital loss. Always do your own research (DYOR) and consult a qualified financial advisor before making any decision.
Article produced with the assistance of artificial intelligence and reviewed by the editorial team.


 ambcrypto.com

 news.bitcoin.com