


 1
1
As of July 24, 2026, the technical picture for Bittensor crypto is unambiguous. The asset trades at $188.10 against $USDT, sitting in a structural bear regime across every timeframe. When all charts point the same direction, it is no longer noise but a clear warning.
Key takeaways
- $TAO trades at $188.10 with all moving averages stacked bearishly across daily, hourly, and 15-minute charts — a rare uniform pattern that signals sustained distribution.
- The daily RSI at 35.87 hovers above oversold without signaling exhaustion, while the 1H RSI at 27.23 remains deeply oversold yet fails to trigger any bounce.
- The broader market backdrop is hostile: the Fear & Greed Index sits at 28, and the total crypto market cap has fallen 1.31% to approximately $2.27 trillion.
- The $185.13 daily S1 and the $187.50–$187.75 confluence zone form the critical support cluster that will determine the next directional move.
- A daily close above $190 with improving MACD and RSI momentum is the minimum condition required to begin challenging the bearish structure.
Daily Timeframe Confirms a Deeply Bearish Macro Structure
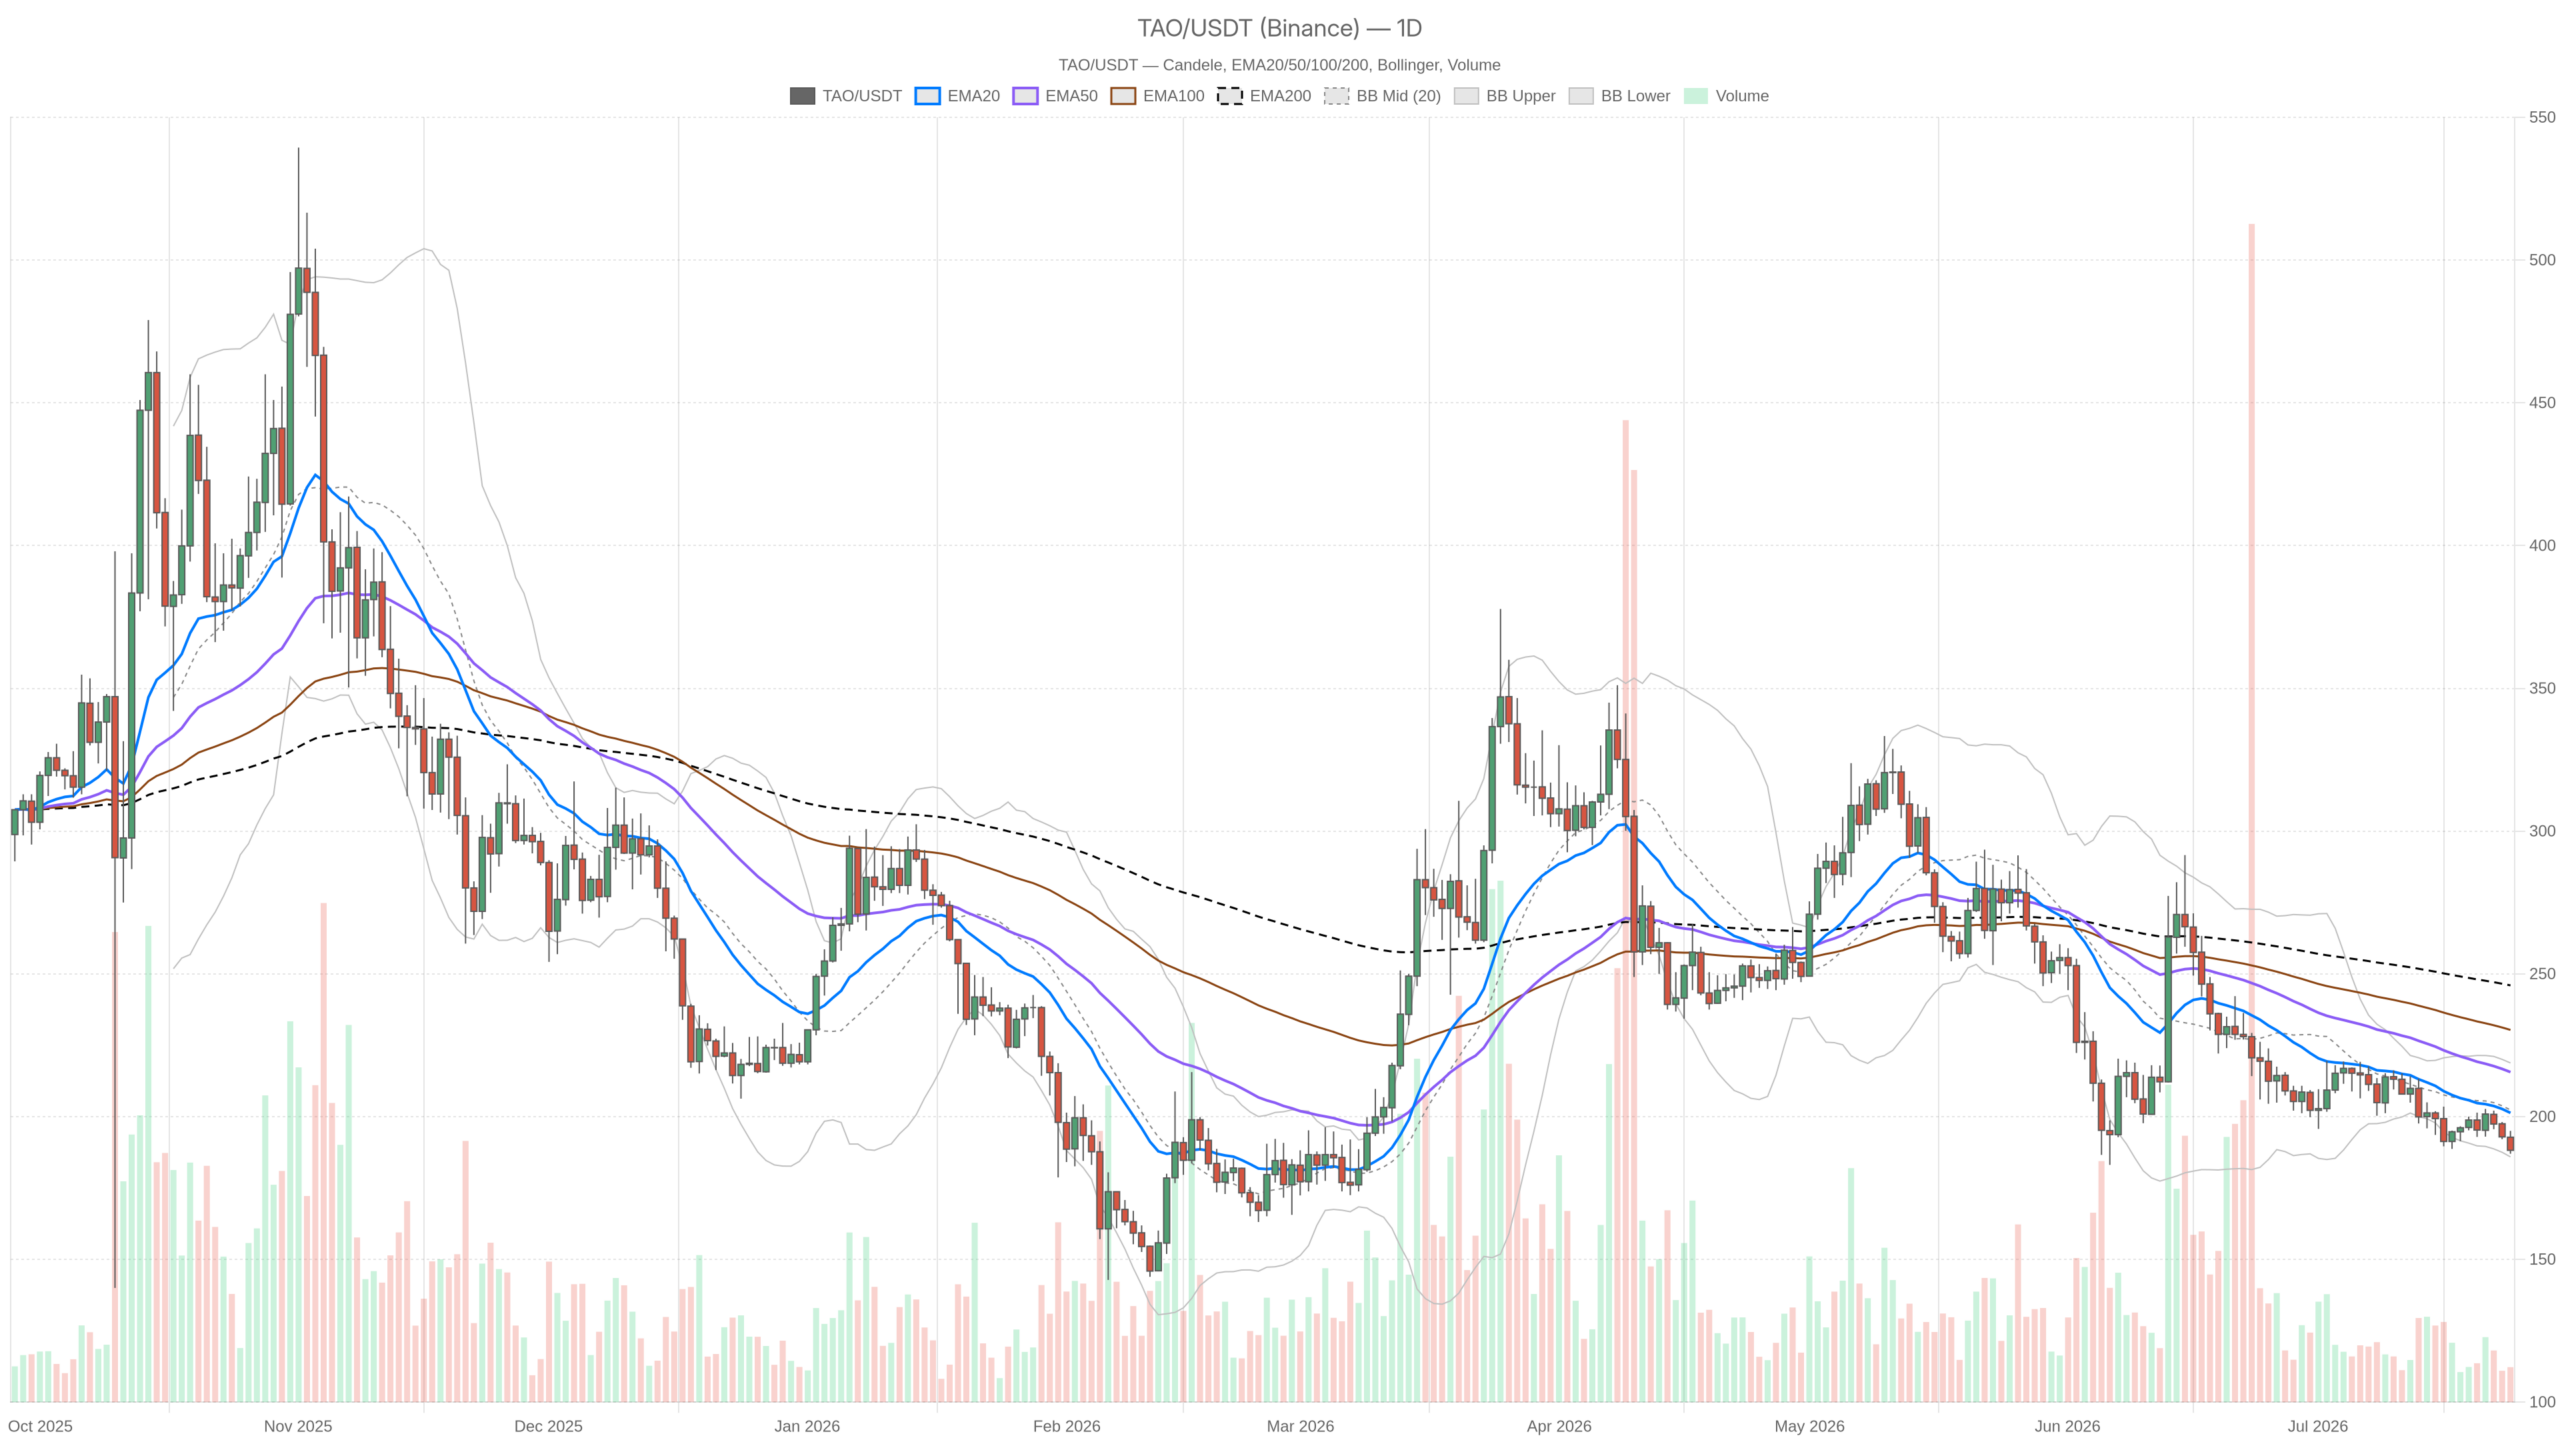
The daily chart confirms a deeply bearish macro structure for $TAO, with price trading well below all three key moving averages in perfect bearish alignment. This configuration reflects sustained distribution rather than a temporary dip, and it does not unwind quickly.
$TAO closed at $188.20, well below its EMA20 at $201.31, EMA50 at $215.60, and EMA200 at $245.97. All three are stacked in perfect bearish order with price underneath. The daily RSI at 35.87 hovers just above the oversold threshold without crossing it. This suggests sellers remain in control, lacking the exhaustion signal that might attract contrarian buyers.
The MACD confirms the picture: the line sits at -6.9 against a signal of -6.8, with a histogram of -0.1 that is essentially flat. Moreover, downward momentum has stopped accelerating but has not yet reversed. Meanwhile, Bollinger Bands place the midline at $202.35 and the lower band at $185.89, with price pressing against the lower boundary — a setup that typically signals either a bounce or a breakdown.
The daily pivot levels add further context. The pivot point sits at $190.07, R1 at $193.13, and S1 at $185.13. With price at $188.20, the market is already below the pivot, representing a technically weak positioning. Furthermore, the ATR of 8.46 confirms genuine volatility, making daily moves of $8–$10 entirely plausible.
Hourly Chart Shows Oversold Conditions Without a Bounce
The hourly chart reveals an even more distressed picture, with the RSI plunging to 27.23 — a genuinely oversold reading that has failed to trigger any meaningful bounce. That failure is one of the most telling signals in the current setup, because it indicates sellers are aggressive enough to absorb all dip-buying demand at these levels.
The 1H MACD reinforces the bearish tone: the line sits at -1.39 against a signal of -1.00, and the histogram has deepened to -0.40. In fact, momentum is still diverging to the downside on this timeframe, confirming that selling pressure has not yet exhausted. Price at $188.10 sits below the 1H EMA20 ($192.06), EMA50 ($194.00), and EMA200 ($196.83) — the same bearish stack seen on the daily chart, just compressed.
The 1H Bollinger Band lower line sits at $188.90, meaning price has actually punched below it. That is a volatility expansion signal, and it typically precedes either a sharp reversal or a continuation move. Additionally, the 1H pivot structure reinforces the compression: PP at $188.27, R1 at $188.83, S1 at $187.53. With barely $1.30 between support and the first resistance, this coiled setup demands close attention.
15-Minute Frame Reveals the Execution Confluence Zone
The 15-minute chart identifies a critical execution zone between $187.50 and $187.75, where multiple support levels converge and make it the key intraday level to monitor. The RSI at 30.43 flirts with oversold territory, while the MACD remains negative with the histogram at -0.26.
All three EMAs on the 15-minute frame — the 20 at $190.33, 50 at $191.70, and 200 at $194.42 — remain stacked above current price, maintaining the universally bearish alignment. The lower Bollinger Band at $187.63 aligns closely with the 1H S1 pivot support at $187.53, creating a meaningful confluence for intraday execution.
A hold here with a positive MACD crossover on the 15m would be the first credible early sign of stabilization. However, absent that signal, the level becomes a breakdown zone rather than a support — and the coiled tension in the hourly chart suggests the resolution will not be subtle.
Bullish and Bearish Scenarios: What Confirms or Invalidates Each Path
The bullish case requires reclaiming the daily pivot at $190.07 on at least one daily close, while the bearish scenario targets $185.13 as the next decisive support. The current structure favors the latter. For $TAO to mount a credible recovery, it must clear several technical hurdles in sequence.
Above $190.07, the next real test is R1 at $193.13. A move back through $201–$202 would bring the daily EMA20 and Bollinger midline into play — a genuinely constructive shift. What would confirm this path is the 1H MACD flipping positive while RSI climbs back above 40. Those two conditions together would indicate that hourly momentum has genuinely turned, not just bounced from oversold territory.
Conversely, the bearish case is more consistent with the current structure. If $185.13 — the daily S1 — gives way on a closing basis, the next identifiable support is the daily lower Bollinger Band at $185.89, which is already uncomfortably close. A confirmed break below the lower BB would signal volatility expansion to the downside. The invalidation for the bearish case is a clean daily reclaim of $193 with volume, at which point the structure would shift from distribution to potential accumulation.
Risk Assessment: Why Patience Matters Right Now
Every timeframe on $TAO is aligned bearish as of this writing, and the broader market environment provides no external catalyst for a reversal. The Fear & Greed Index at 28 and the declining total crypto market cap at approximately $2.27 trillion, down 1.31% over 24 hours according to CoinGecko, confirm that risk appetite remains thin across the board.
In such high-beta environments, assets like $TAO tend to get hit disproportionately hard. Bittensor crypto is not in a situation where catching the falling knife is a low-risk proposition, and the daily ATR of $8.46 means a single session can erase or create meaningful positions. Those already long need to be honest about whether $185 holds, while sidelined traders have the luxury of waiting for confirmation.
A daily close back above $190 with improving momentum indicators would shift the risk-reward calculus materially. Until that happens, however, the burden of proof lies entirely with the bulls. Markets in fear tend to stay oversold longer than logic suggests they should, and the oversold hourly readings that have failed to produce a buying response make the contrarian case difficult to support. $TAO, right now, is a clear example of that dynamic in action.
FAQ
Is Bittensor crypto in a bear market right now?
Yes. As of July 24, 2026, $TAO trades at $188.10 with all moving averages — EMA20, EMA50, and EMA200 — stacked in perfect bearish order across every timeframe, from the 15-minute chart up to the daily. The daily RSI at 35.87 sits above oversold but below neutral, and the MACD remains negative with a flat histogram. This uniform alignment across short, medium, and macro timeframes confirms a structural bear regime rather than a temporary pullback.
What are the most important support levels for $TAO right now?
The most immediate support cluster lies between $187.50 and $187.75, where the 15-minute lower Bollinger Band and the 1H S1 pivot converge. Below that, the daily S1 at $185.13 and the daily lower Bollinger Band at $185.89 form the critical macro floor. A confirmed close below $185.13 would likely accelerate selling pressure, as no major technical support sits immediately beneath that level.
What would confirm a trend reversal for $TAO?
A credible reversal would require a daily close above the pivot at $190.07, followed by a reclaim of R1 at $193.13. Beyond price levels, the 1H MACD would need to flip positive while the hourly RSI climbs back above 40 — both conditions are necessary to confirm that momentum has genuinely shifted from bearish to recovering. Until these signals align, the downtrend remains intact.
Disclaimer: This article is for informational purposes only and does not constitute financial advice, an investment recommendation, or a solicitation to buy or sell any financial instrument or cryptocurrency. The analysis provided is not indicative of future results. Investing in crypto assets and financial markets carries a high risk of capital loss. Always do your own research (DYOR) and consult a qualified financial advisor before making any decision.
Article produced with the assistance of artificial intelligence and reviewed by the editorial team.

 ambcrypto.com

 coinpedia.org
 u.today

 invezz.com