


 11
11
$XRP has entered one of the most important stages on its weekly chart, placing it at an inflection point that could determine its next major move.
$XRP is currently trading at around $1.1063 after reaching a weekly high of $1.1638 before pulling back. Currently, the crypto asset is down 4.32% in the week, on track to end the session in negative territory.
Amid the downward price action, several indicators have converged to create a setup that could lead to a major move. As a result, the question is no longer whether $XRP will make a major move from here, but whether it will rally higher or fall toward the $0.70 area.
Fibonacci Levels Show Where $XRP Could Move Next
Notably, a Fibonacci retracement grid drawn from $XRP’s cycle low of $0.3814 to its cycle high of $3.6662 covers the entire rally that took place between late 2024 and early 2025. Since reaching the peak, $XRP has moved lower, passing through several key Fibonacci levels.
At the current price of $1.1063, $XRP trades just above the 18.75% Fibonacci retracement level at $0.9980. The next major support lies at the 12.50% retracement level of $0.7925, which stands as the final important support before the price could return to the base of the previous bull run.
Several resistance levels also contributed to this decline. Specifically, the 33% Fibonacci level at $1.4626 acted as an important support before $XRP lost it. Once the price fell below that level, it never regained it.
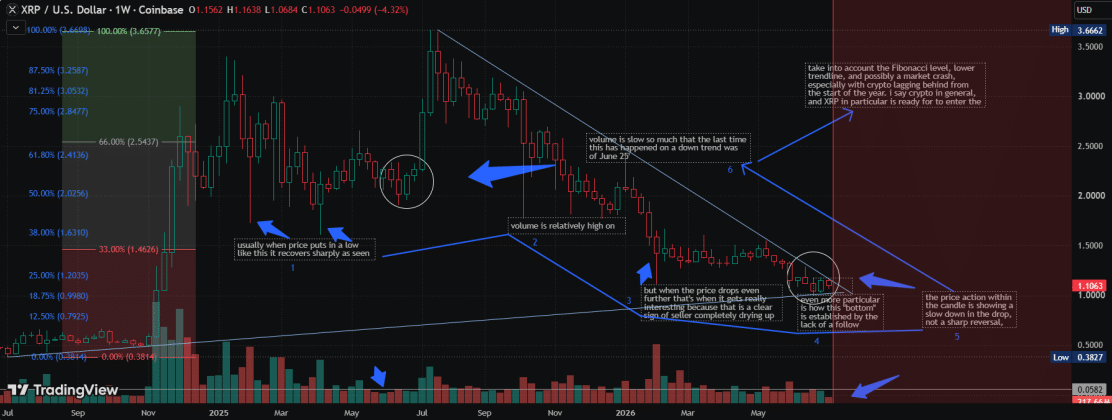
Higher up, the 50% retracement level at $2.0256 stopped the recovery attempt in January 2026. The 61.80% golden pocket at $2.4136 and the 66% retracement level at $2.5437 also rejected price during the extended topping phase near the July 2025 highs.
Symmetrical Triangle Puts $XRP at a Decision Point
Meanwhile, data from the weekly chart shows a symmetrical triangle that now defines $XRP’s overall structure.
Notably, $XRP currently witnesses a downward-sloping trendline that starts from the $3.6662 peak and connects several lower highs. At the same time, the chart features an upward-sloping trendline that has acted as support. While the upper trendline formed in July 2025, the lower line started forming in 2024.
These two trendlines have squeezed $XRP into the triangle’s apex, where price now sits. Since symmetrical triangles do not favor either buyers or sellers, the market now waits for the next breakout to reveal the direction.
A breakout above the upper trendline could push $XRP toward $1.4626, followed by $2.0256, and later the $2.40 to $3.00 range.
However, if the price breaks below the lower trendline, $XRP would lose its nearby technical support and could fall toward the $0.7925 Fibonacci level, which aligns with a possible move to around $0.70.
Volume Suggests Selling Pressure Is Fading
Importantly, $XRP’s trading volume reveals how market sentiment has changed amid the ongoing price action. When $XRP recovered from its early 2025 low, strong buying activity drove a sharp V-shaped rebound, showing that buyers had returned with confidence.
However, after the July 2025 peak, the market moved lower on heavy selling volume. This confirmed that sellers remained firmly in control instead of allowing prices to drift lower on weak trading activity.
As the downtrend continued, trading volume gradually became lighter even though $XRP kept falling. This pattern suggests that selling pressure has started to weaken.
However, weaker selling alone does not confirm a reversal. Buyers still need to return with enough strength to establish a lasting recovery. Current weekly volume now resembles the quiet trading conditions seen in June 2025, a period that came just before a major price move.

 cryptopotato.com
 coinpedia.org
 en.bitcoinsistemi.com
 2
2
