



 10
10
Solana is pulling back into a key breakout zone while traders compare the current setup with its 2023 recovery base. If $SOL holds the $74-$77 area, the chart keeps the path open toward $93 first, with $115-$127 still possible later.
Solana 2026 Chart Mirrors 2023 Setup as Traders Watch for Entry
Solana’s current structure is being compared with its 2023 recovery phase, when $SOL built a base before a strong upside move. One trader says he is waiting for a better entry before buying again, as the chart suggests the larger setup may still need more time.
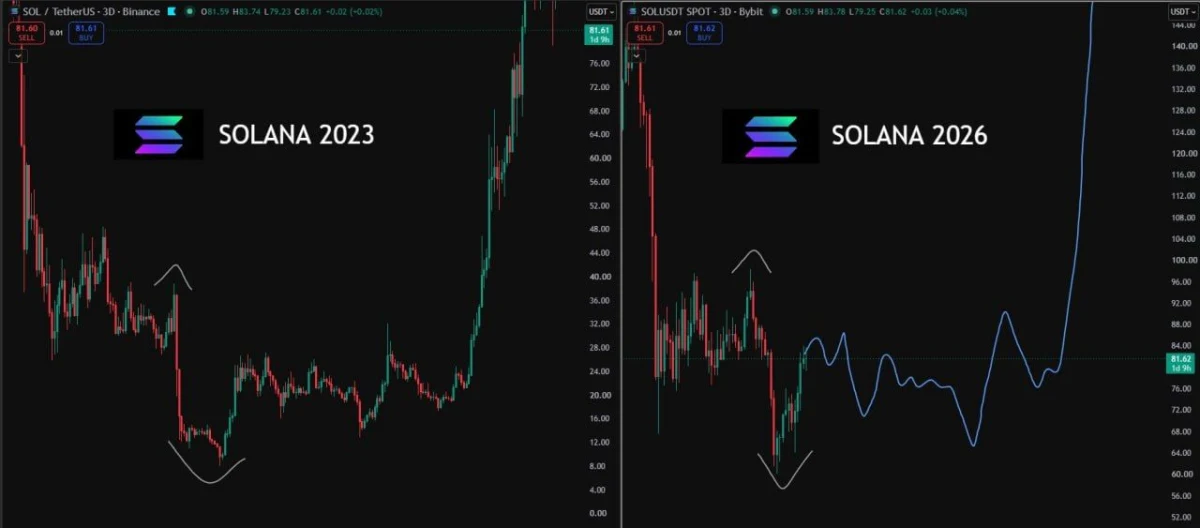
$SOL/$USDT 3-day chart. Source: Ryker on X, TradingView
The chart compares Solana’s 2023 price action with its current 2026 structure.
On the left, the 2023 chart shows $SOL falling sharply, building a rounded bottom and then breaking into a strong rally. On the right, the 2026 chart shows a similar early-stage base forming after another steep decline.
According to Ryker, he bought $SOL at $40 in the last cycle and sold at $122. He is now waiting for another good entry before buying again.
The projected path on the chart suggests $SOL may continue moving sideways first before a stronger rally develops. That would match the earlier cycle structure, where price needed time to build a base before the larger move began.
The key area to watch is the current support range near the recent lows. If $SOL holds that structure, the comparison with 2023 becomes stronger.
However, the setup still needs confirmation. A clean breakout above nearby resistance would be needed before the larger bullish case becomes more reliable.
For now, the chart points to patience. Solana may be forming a familiar cycle setup, but the better entry could depend on whether price holds support and confirms the next move higher.
Solana Retests Breakout Zone as Bulls Watch $74-$77 Support
Solana has pulled back into a key support and breakout zone, where one trader says he has started adding to his position again. If $SOL holds this area, the chart suggests another local low could form before a move higher.
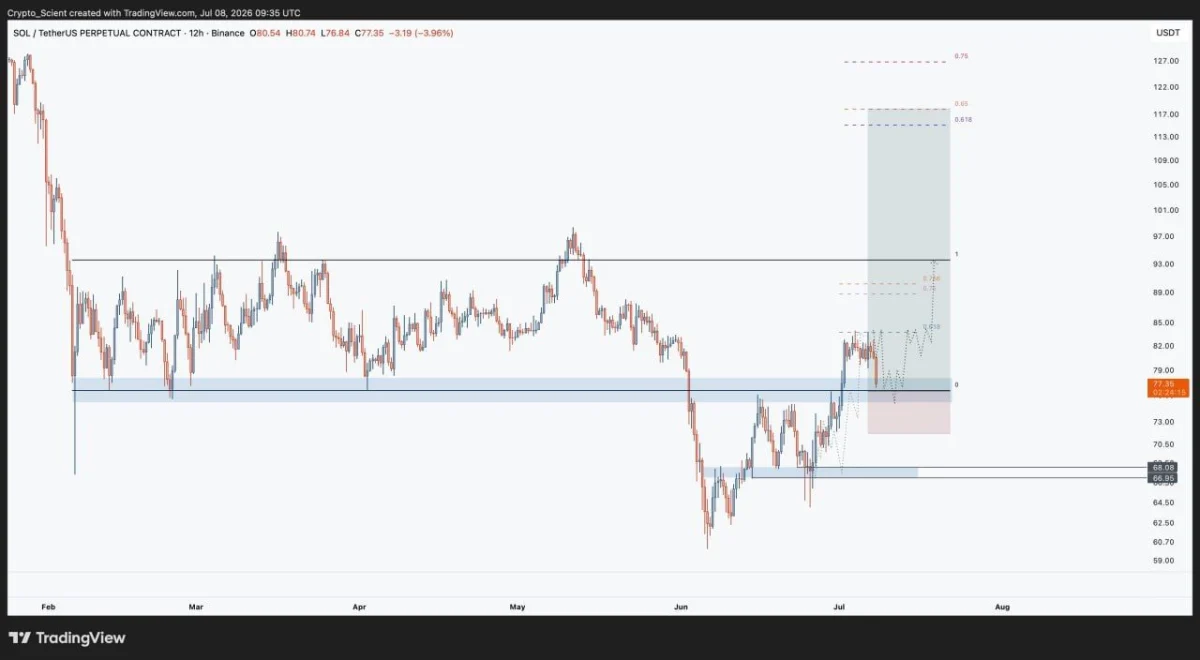
$SOL/$USDT 12-hour chart. Source: Scient on X, TradingView
The chart shows $SOL pulling back after a sharp recovery from the June lows. Price has now returned to the blue support zone that previously acted as a breakout area.
According to Scient, $SOL has reached the support, range low and breakout zone he was watching. He said he started adding size again at support and has bids placed down to $74.
That makes the $74-$77 area important. If buyers defend this zone, the retest could confirm that the old resistance has turned into support.
The chart also shows a possible path higher if the support holds. The first major target sits near $93, while the larger upside area extends toward the $115-$127 region.
However, the setup still needs confirmation. If $SOL loses the support zone, the next lower area around $66-$68 could come back into focus.
For now, the key test is whether Solana can hold the breakout retest. A strong reaction from this zone would keep the bullish continuation setup alive.

 u.today


 finbold.com

 coinpedia.org
 coinfomania.com