


 3
3
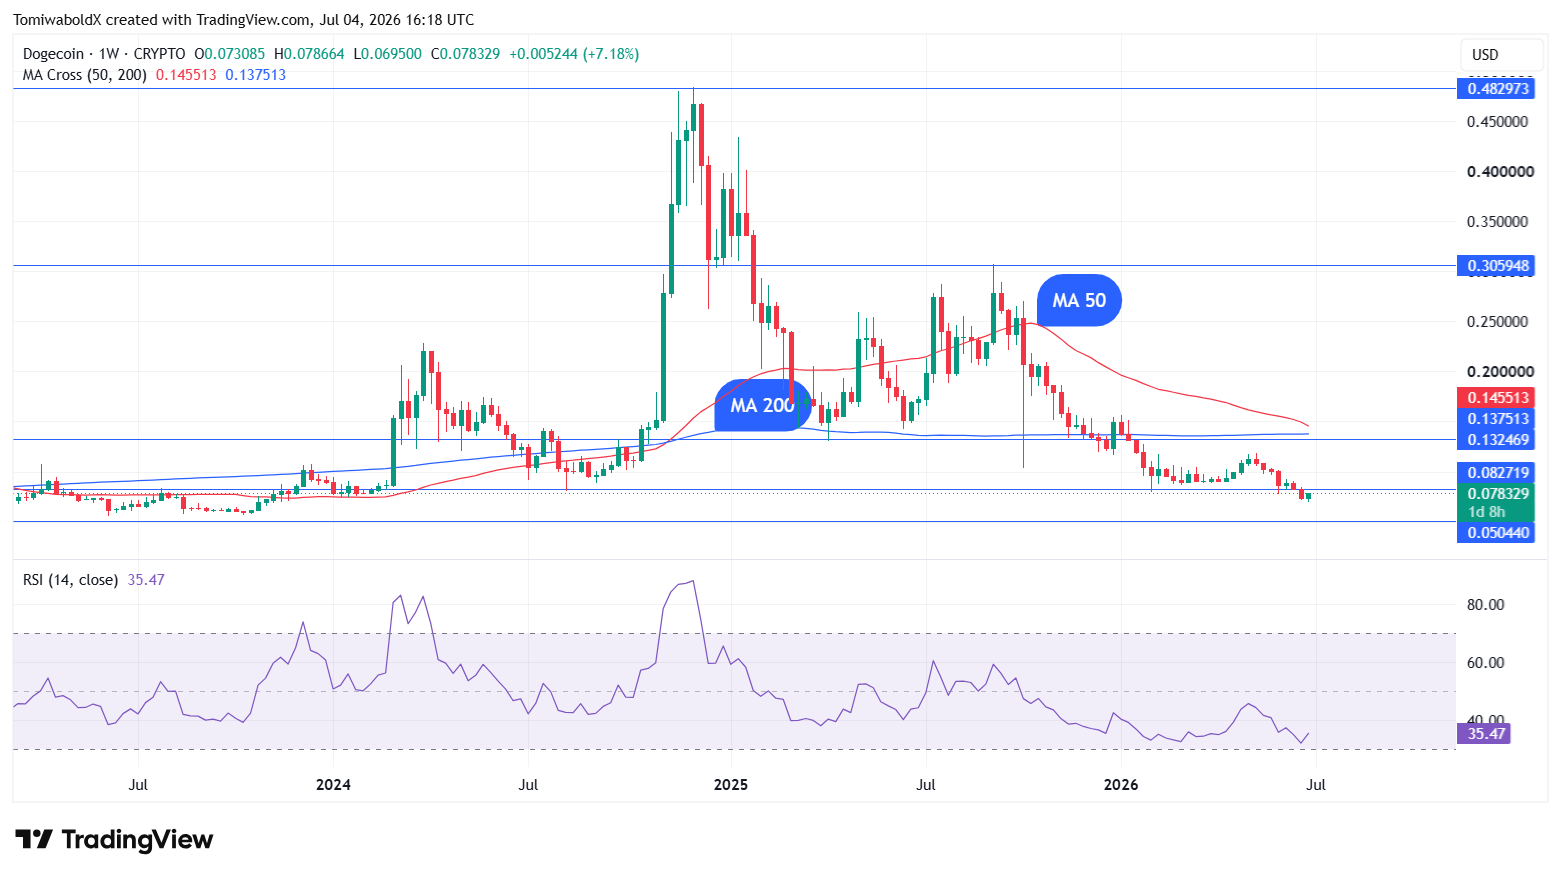
A potential death cross setup seems to be taking shape on Dogecoin's weekly chart, with traders now paying close attention.
The weekly MA 50 (50 WMA) has pulled downwards and might meet the 200 WMA in the coming weeks. If the 50 WMA falls beneath the 200 WMA following the convergence, a death cross signal might be confirmed.
While golden and death cross signals are not new to Dogecoin, as a handful have appeared on short-term timeframes since its inception, the weekly chart remains an exception, having seen only three such crossovers since February 2021. Two of these three instances are golden cross signals, highlighting the rarity of a death cross on its weekly chart.
In particular, this rare bearish technical signal has not appeared on its weekly chart in more than three years. The last time Dogecoin saw a death cross on its weekly chart was in February 2023.
Will history repeat?
Dogecoin price action has often mirrored the nature of the crossovers on its weekly price charts. In February 2021, when Dogecoin recorded a golden cross on its weekly chart, the price increased in the following months.
Dogecoin saw a 3,600% increase after the price rose from a low of $0.02 on February 1, 2021, to reach an all-time high of $0.74 in May 2021.
A similar scenario played out in November 2024 following the appearance of a golden cross on the weekly chart. Starting from October of the same year, Dogecoin increased for eight consecutive weeks, reaching a high of $0.48 in December 2024, before receding.
However, the only visible death cross on the weekly chart produced a muted reaction, with Dogecoin price stagnation recorded in the aftermath. Dogecoin price traded in a range for months following the February 2023 death cross, with little momentum recorded shortly after the signal appeared.
At the time of writing, $DOGE was trading at $0.074.
