

 2
2
Sky [$SKY] has pushed higher across the market, with the asset surging by 12% over the last 24 hours. In fact, its technical picture seemed to point to the possibility of sustained upward momentum on the charts.
While on-chain activity mapped out a clear path at press time, chart patterns suggested the crypto could stretch even further and extend its trajectory.
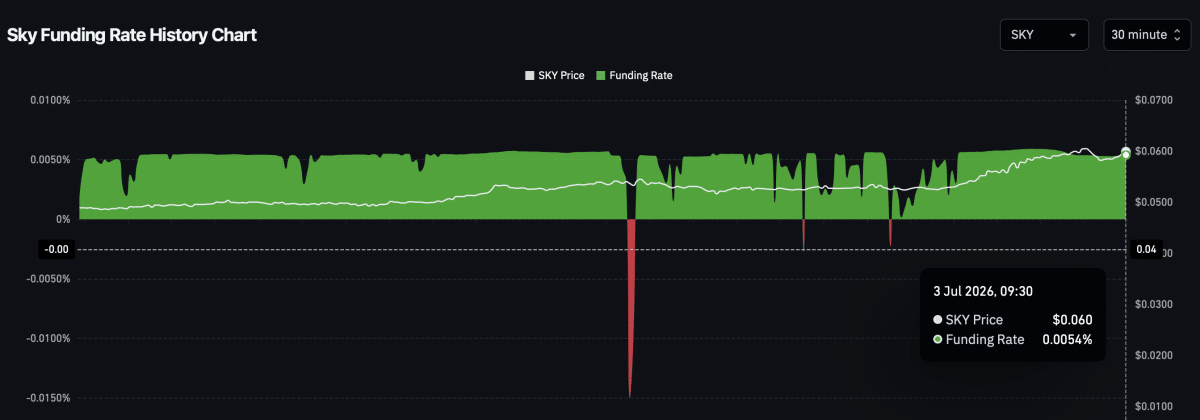
Is the funding rate overheating?
The clearest indicator pointing to the rally continued was the funding rate data. Funding rates reveal which way capital in the perpetual market is tilting and whether long or short trades dominate the flow.
At the time of writing, the funding rate was flashing positive while holding at a moderately high level. This suggested that bullish positioning had not turned excessive, with the setup still favoring the price.
What seemed to make the run look sustainable was the fresh capital flowing into the market, with Open Interest climbing. In fact, Open interest jumped by 14.25% to hit $30.24 million at the time of writing.
These inflows totaled $4.3 million over the past 24 hours. Capital moving in with the funding rate staying positive may be evidence that long traders still expect more upside and are positioning for it, without tipping into excessive bullishness.
At press time, the funding rate was just 0.0054% – A moderately bullish reading that may be enough to keep the outlook intact.
Volume rises in step with price
The volume has kept climbing alongside the price, a combination that alluded to positive momentum behind the altcoin.
At press time, the volume was up 106% and had a reading of $31 million. A closer look at the perpetual market also revealed the same sentiment carrying through that segment.
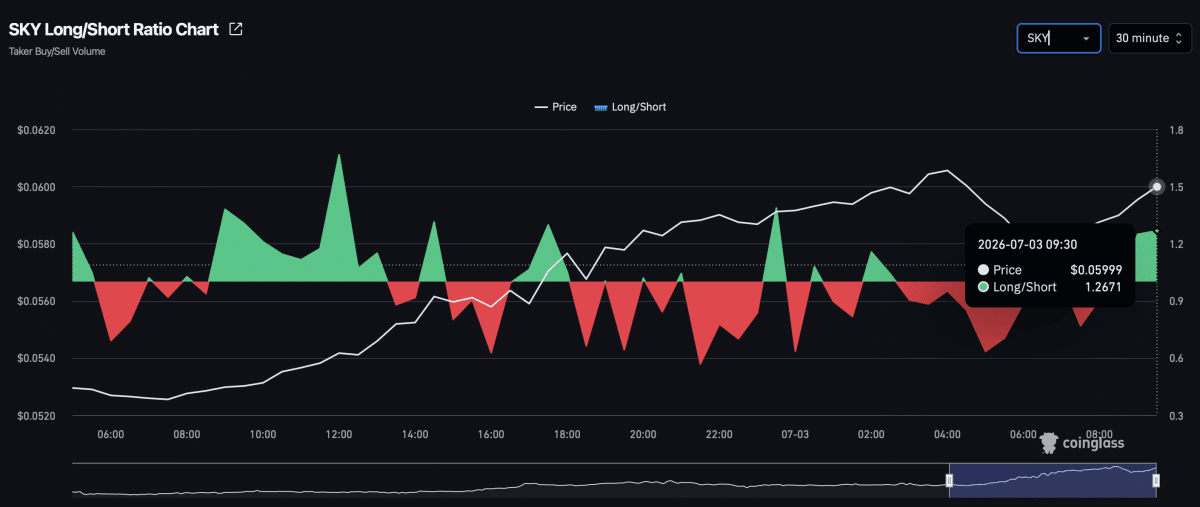
The perpetual market’s long-to-short ratio climbed too, reaching a fresh high of roughly 1.27. This suggested that most trading accounts were leaning bullish.
The long-to-short ratio measures whether bulls or bears lead a market. A reading above 1 usually points to more buying volume, while a reading below 1 hints at more selling volume.
In $SKY’s case, the ratio has kept trending higher, meaning more accounts have been shifting in the same direction as the altcoin maintained its upward thrust.
Is $SKY eyeing the next resistance level?
$SKY flashed signs of bullishness on the charts, with the altcoin breaking through a descending resistance trendline it has trailed for weeks.
Following that breakout, the price cleared another key horizontal resistance level and pushed higher still. For a confirmed bullish outlook, the price needs to close comfortably above this level and keep forming upward candles.
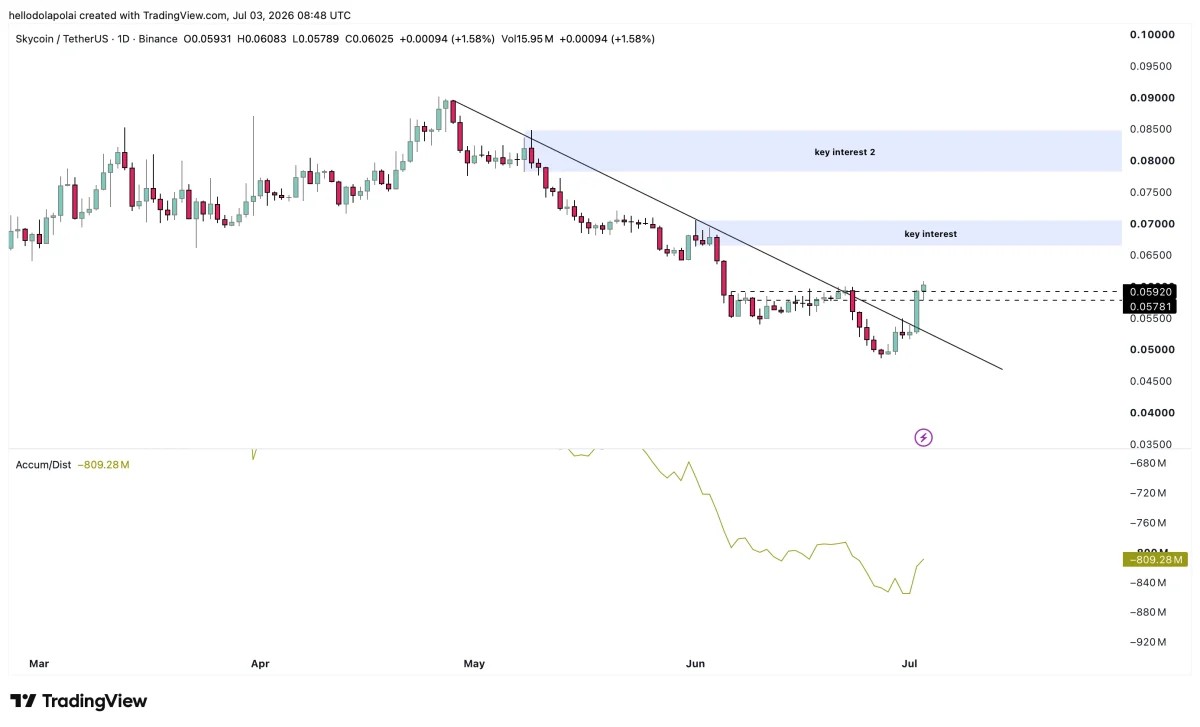
Two key levels of interest will come into play if buying pressure holds, marked by the two boxes on the chart. Clearing them would meaningfully shift the price outlook.
At press time, the Accumulation/Distribution indicator—which tracks whether buying or selling dominates—showed the former in control, implying $SKY could force a further upswing.
Final Summary
- $SKY climbed by 20% in a day, with the money flowing into the market suggesting traders may be betting on the rally going further.
- Rising volume and a growing tilt towards buyers hinted at real momentum behind the move.

