


 9
9
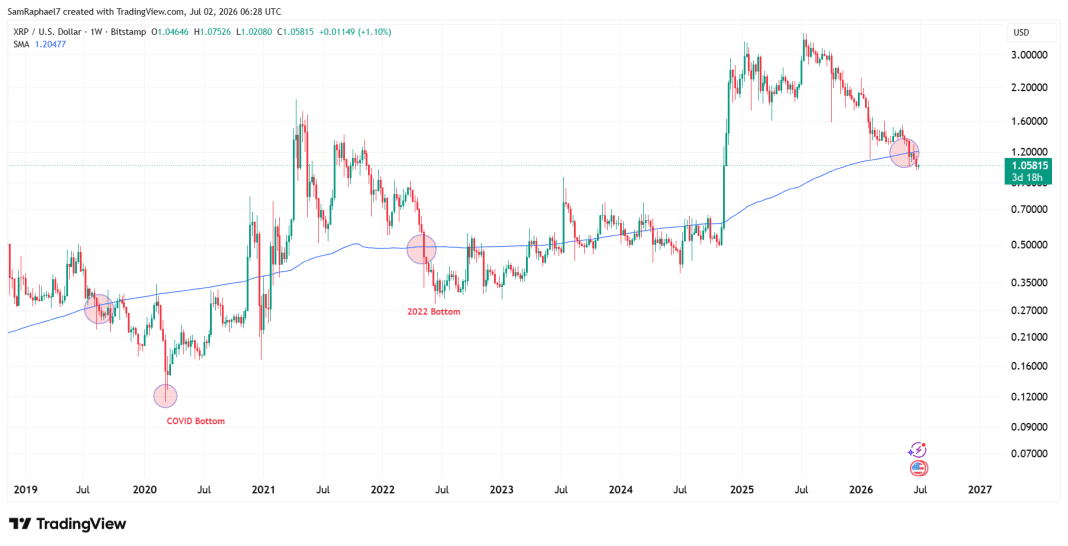
$XRP has now closed below the 200-week moving average for the first time since the 2024 rally, confirming the overall bearish market trend.
This move comes during the ongoing downtrend that started in Q4 2025 and has now lasted for ten months. Despite the decline, past trends suggest that a drop below this major moving average after an uptrend can indicate that a possible bottom may be forming.
However, it does not necessarily mean prices will recover right away. In most cases, this phase represents a change toward stabilization, not an immediate rebound.
$XRP Closes Below 200WMA
Specifically, in the first week of June, $XRP closed at $1.155, while the 200-week moving average stood at $1.189, confirming the breakdown.
This marked the first time $XRP traded below this level and the first weekly close under it since the first week of November 2024, just before the Donald Trump-led market rally.
The 200WMA represents the average price over about four years of weekly closes, and this makes it an important long-term benchmark. When prices stay below it, it shows that most medium- and long-term holders are now holding at a loss.
Since the breakdown, $XRP has now spent three weeks below the 200WMA and is heading into a fourth week. At the time of writing, $XRP trades at $1.0584, while the moving average has climbed to $1.20.
The 200WMA has also flipped from dynamic support to resistance. This means that if price moves back toward it, sellers are more likely to step in, which could limit any short-term recovery attempts.
How $XRP Behaved in 2022
A similar breakdown occurred during the Terra ecosystem collapse in May 2022, when $XRP closed below the 200WMA in the second week of May 2022 for the first time in over a year.
After that, $XRP remained below the moving average for five weeks before reaching a cycle low of $0.28 in June 2022.
Although this level marked the bottom, recovery did not happen quickly. Specifically, $XRP did not begin a clear uptrend until November 2024, more than two years later.
During that time, the price oscillated above and below the 200WMA multiple times before finally breaking above it during the November 2024 rally, which confirmed a stronger trend.
$XRP’s 2019 Case
Before that, $XRP showed a similar pattern in August 2019, when it closed below the 200WMA after an uptrend. It then stayed below the moving average for five weeks and reached a low of $0.22 in September 2019, which seemed like a bottom at the time.
However, the recovery that followed this floor price failed, and $XRP dropped below the moving average again, eventually falling further to $0.11 in March 2020, about seven months after the initial breakdown.
Nonetheless, most analysts see this as an exception because it was caused by the COVID-19 market crash, an unexpected global Black Swan event.
Meanwhile, after reaching the $0.11 bottom in March 2020, $XRP eventually staged a recovery effort. The price later moved back above the 200WMA in January 2021, which led to a strong rally that pushed the asset up to $1.96 by April 2021.
Is This a Buying Opportunity?
If no major external shock occurs, $XRP could follow the 2022 pattern, where it formed a bottom within a few weeks after falling below the 200WMA.
However, history shows that reaching a bottom does not mean a new bull run will begin immediately. In the 2022 cycle, $XRP still spent nearly two years moving around the 200WMA, struggling to stay above it before finally breaking out.
For now, even if $XRP finds a bottom soon, the market may only see short-term relief rallies instead of a strong recovery. A longer period of sideways movement could come before any clear uptrend begins.
