

 2
2
Shiba Inu trades at $0.0000421 on July 1, up 0.24% after a month that wiped out nearly a quarter of its value. Large holders kept pulling $SHIB off exchanges even as the meme coin sector broadly collapsed.
Is $SHIB’s Downtrend Showing Any Signs Of Slowing?
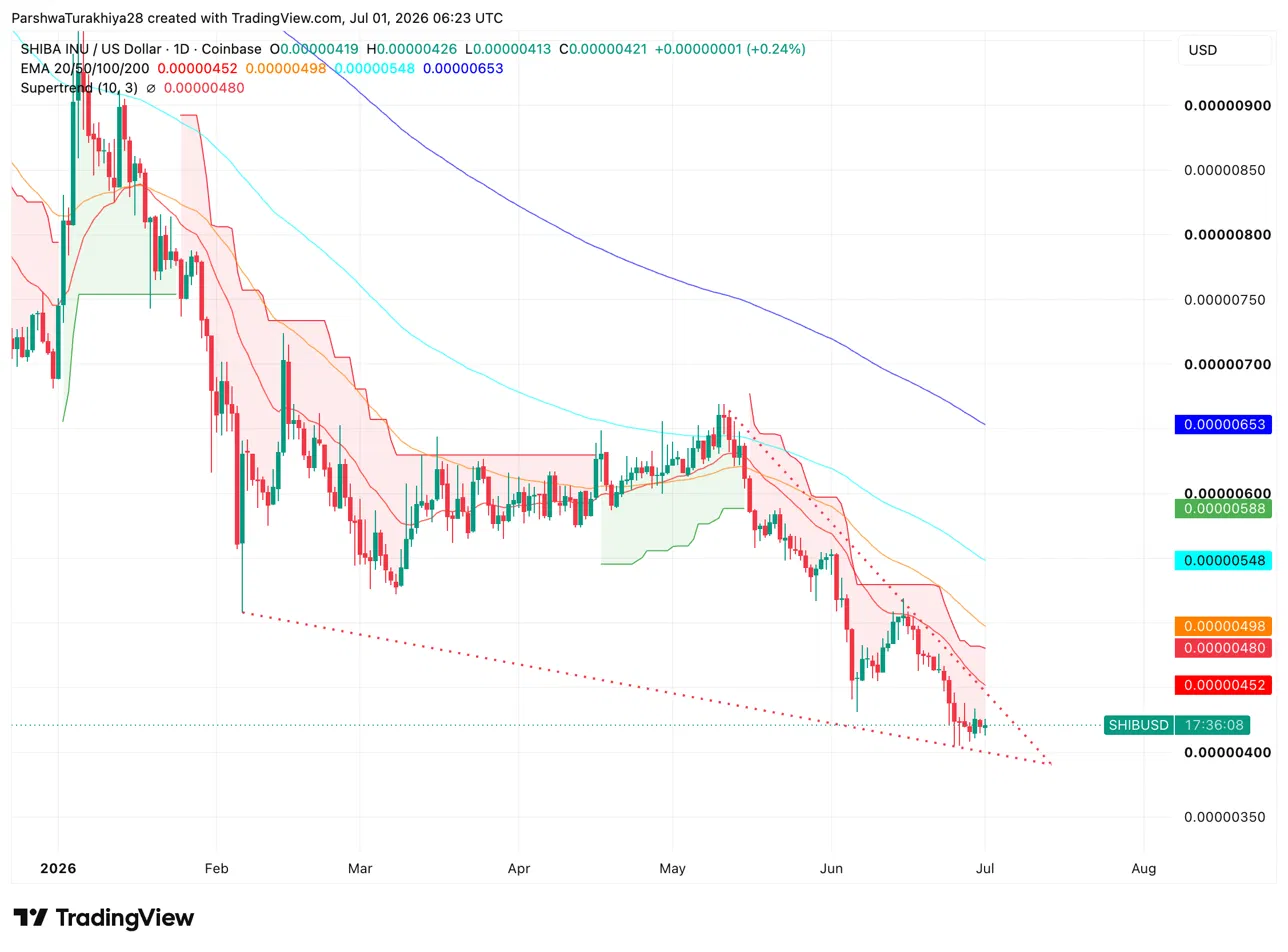
The daily chart shows $SHIB locked in a steep downtrend since May, trading below every major moving average. The 20-day EMA sits at $0.00000452, the 50-day at $0.00000498, the 100-day at $0.00000548 and the 200-day at $0.00000653, all stacked above spot in a textbook bearish formation. The Supertrend (10,3) at $0.00000480 also remains above price, keeping sellers in technical control.
A descending channel has tightened sharply over the past three weeks, with price compressing toward the lower trendline near $0.00000400. That squeeze often resolves with a sharp move in either direction once price runs out of room.
What Are The Key Support And Resistance Levels For $SHIB?
- Support at $0.00000413 and the psychological $0.00000400 floor
- Resistance at $0.00000452 on the 20-day EMA, then $0.00000480 on the Supertrend
What Do $SHIB Derivatives Signal About Current Sentiment?
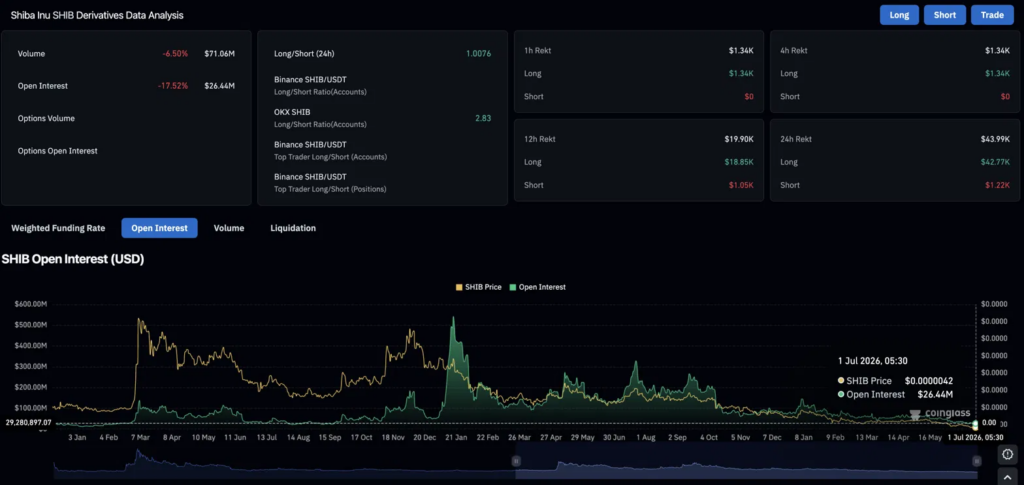
Derivatives volume fell 6.50% to $71.06M while open interest dropped 17.52% to $26.44M, both declining together, pointing to traders exiting rather than rotating into new positions. The long/short ratio sits at 1.0076, almost perfectly balanced, meaning no side has a clear conviction trade on right now.
Liquidations over 24 hours totaled just $43.99K, with longs taking nearly all of it at $42.77K against $1.22K for shorts. These are small numbers by any measure, reflecting how thin active positioning has become at current price levels.
Why Are Whales Buying $SHIB While Meme Coins Collapse?
On-chain data shows a net withdrawal of 781 billion $SHIB from exchanges to private wallets between June 25 and June 29, a scale of accumulation that helped $SHIB hold its spot in the top 30 cryptocurrencies by market cap despite a weekly price drop of over 10%. Whale-sized holders absorbing supply typically shows up as price stability rather than a rally, and that’s exactly what happened, $SHIB didn’t crash further despite heavy sector-wide pressure.
The meme coin market cap fell 33% in June, its steepest monthly drop of 2026, with $SHIB closing the month down 24%. Burn activity offered little relief. The 30-day burn rate is up just 0.4%, and the 7-day rate fell 16.12% after peaking near 4 million tokens burned on June 30. Burns have been event-driven rather than consistent, spiking briefly in early and mid-June before fading back toward near-zero.
Has July Historically Been A Strong Month For $SHIB?
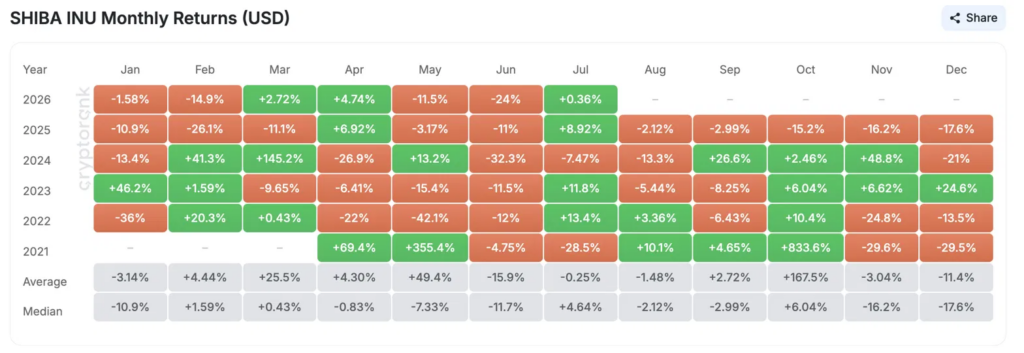
July has been a mixed month for $SHIB historically, averaging a negligible -0.25% across past years. The 2026 reading so far is barely positive at 0.36%, but the sample size is thin and outcomes have been extreme in both directions, from a 13.4% gain in 2022 to a 28.5% drop in 2021. No clear seasonal edge exists for bulls or bears heading into the month.
$SHIB Price Prediction: July 2026 Weekly Forecast
| Period | Price Range | Outlook |
| July 1-5 | $0.0000040 – $0.0000046 | Range-bound as whale withdrawals absorb selling |
| July 6-12 | $0.0000038 – $0.0000048 | Descending channel squeeze resolves, direction unclear |
| July 13-19 | $0.0000040 – $0.0000050 | Potential reclaim of 20-day EMA if market sentiment improves |
| July 20-26 | $0.0000038 – $0.0000052 | Broader meme coin recovery needed to sustain any bounce |
| July 27-31 | $0.0000040 – $0.0000055 | Trend resolution based on BTC direction and sector rotation |
$SHIB Price Prediction: Upside and Downside Targets
- Upside case: Whale accumulation translates into a supply squeeze, $SHIB clears $0.00000480 and pushes toward the 50-day EMA at $0.00000498.
- Downside case: The $0.00000400 floor breaks under continued meme coin sector pressure, sending $SHIB toward $0.00000350.


