


 6
6
Shiba Inu has dropped to lows the market last saw before the May 2021 rally, with prices now gravitating toward key floor levels.
The broader crypto market downtrend has dealt a blow to Shiba Inu ($SHIB), as it records steeper declines than most of the market due to its volatility as a meme coin. $SHIB has collapsed more than 38% this year alone, after posting a massive 67% loss last year.
Amid the ongoing downturn, which has pushed Shiba Inu to lows last witnessed before the May 2021 rally, chart data has highlighted important areas of interest that investors should watch out for should the market rout persist.
Shiba Inu Hits 5-Year Low
After recovering alongside the crypto market to $0.00000520 in mid-June, Shiba Inu faced a roadblock at this high, leading to a massive pullback. Over the 10-day period from June 16 to 25, $SHIB recorded nine intraday losses and traded flat on June 22.
During this period, the meme coin dropped to a local bottom of $0.00000404 by June 25, which culminated in a 20% decline. Interestingly, this $0.00000404 price marked a 5-year low for Shiba Inu, as the asset last saw this area during the historic rally in May 2021.
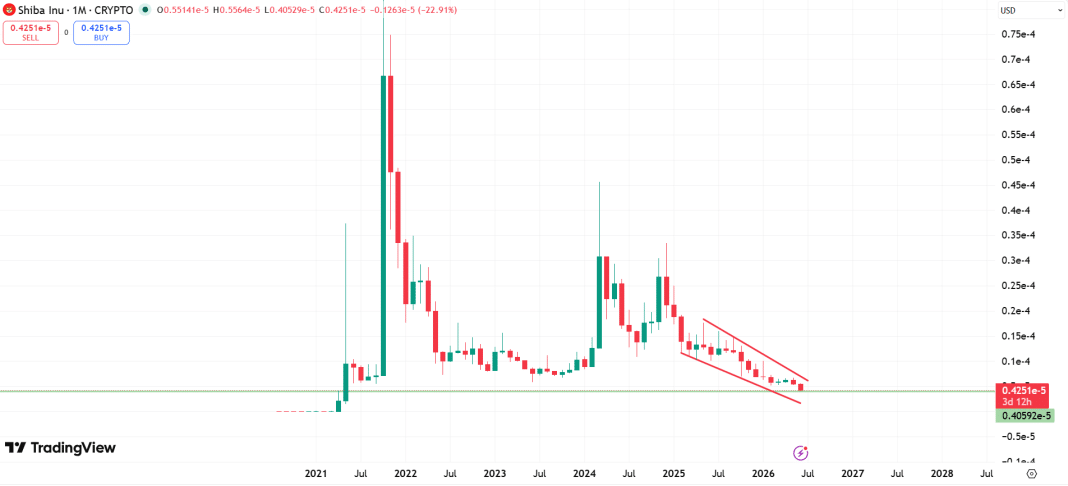
Shiba Inu has since recovered from the $0.00000404 floor, but still trades within a critical area, as it has failed to break its lower-high pattern that has persisted since May 2025. $SHIB is down nearly 23% this month, on track for its largest monthly loss since February 2025.
Key Floor Levels to Watch
However, the possibility of steeper declines cannot be dismissed, as the broader crypto market fails to show any signs of a full-blown recovery. If the market suffers another selloff round from here, Shiba Inu could slump further to new lows.
Specifically, the first area of interest where prices could find solid support is $0.00000241, which aligns with the Fibonacci 1.272 extension. From the current position, Shiba Inu would have to drop by as much as 43% to reach this level.
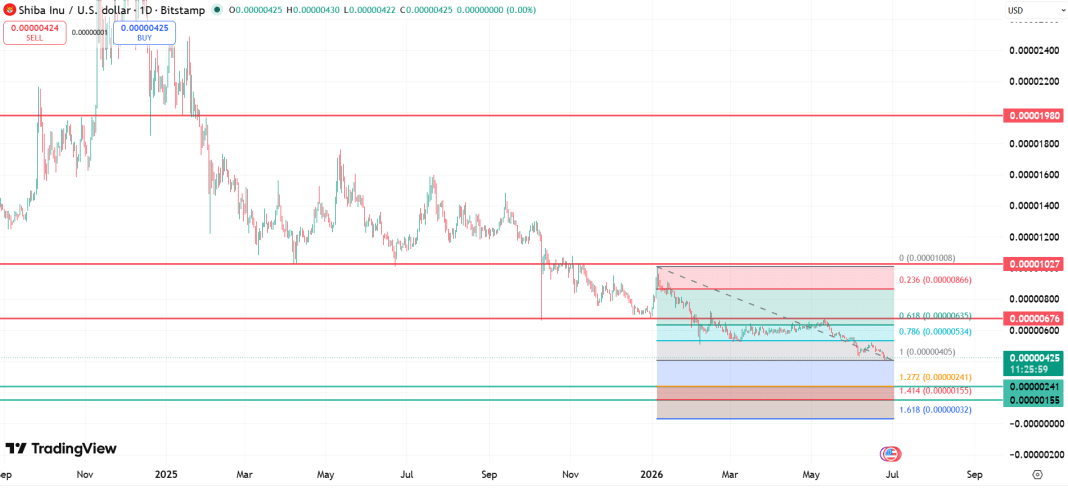
If this area fails to hold, the second line of defense lies at the Fibonacci 1.414 extension sitting at the $0.00000155 price. Crashing to this area would mark a 77% year-to-date decline for Shiba Inu. Bulls will likely step in at this area, as it represents a good entry zone last seen in April 2021.
Shiba Inu Resistance Areas
However, it remains unclear if $SHIB could see such declines from its current position. The meme coin may have a fighting chance if it can reclaim key resistance levels such as the $0.00000676 area, which acted as support from October 2025 to January 2026 before the bears flipped it to resistance.
Above this level is the $0.00001027, which served as a potent defense area from June to October 2023 and then from April to October 2025 before bears breached it. If Shiba Inu can recover above both resistance areas and flip them into support, it could flip the trend for good, possibly eyeing the $0.00001980 target.