
 5
5
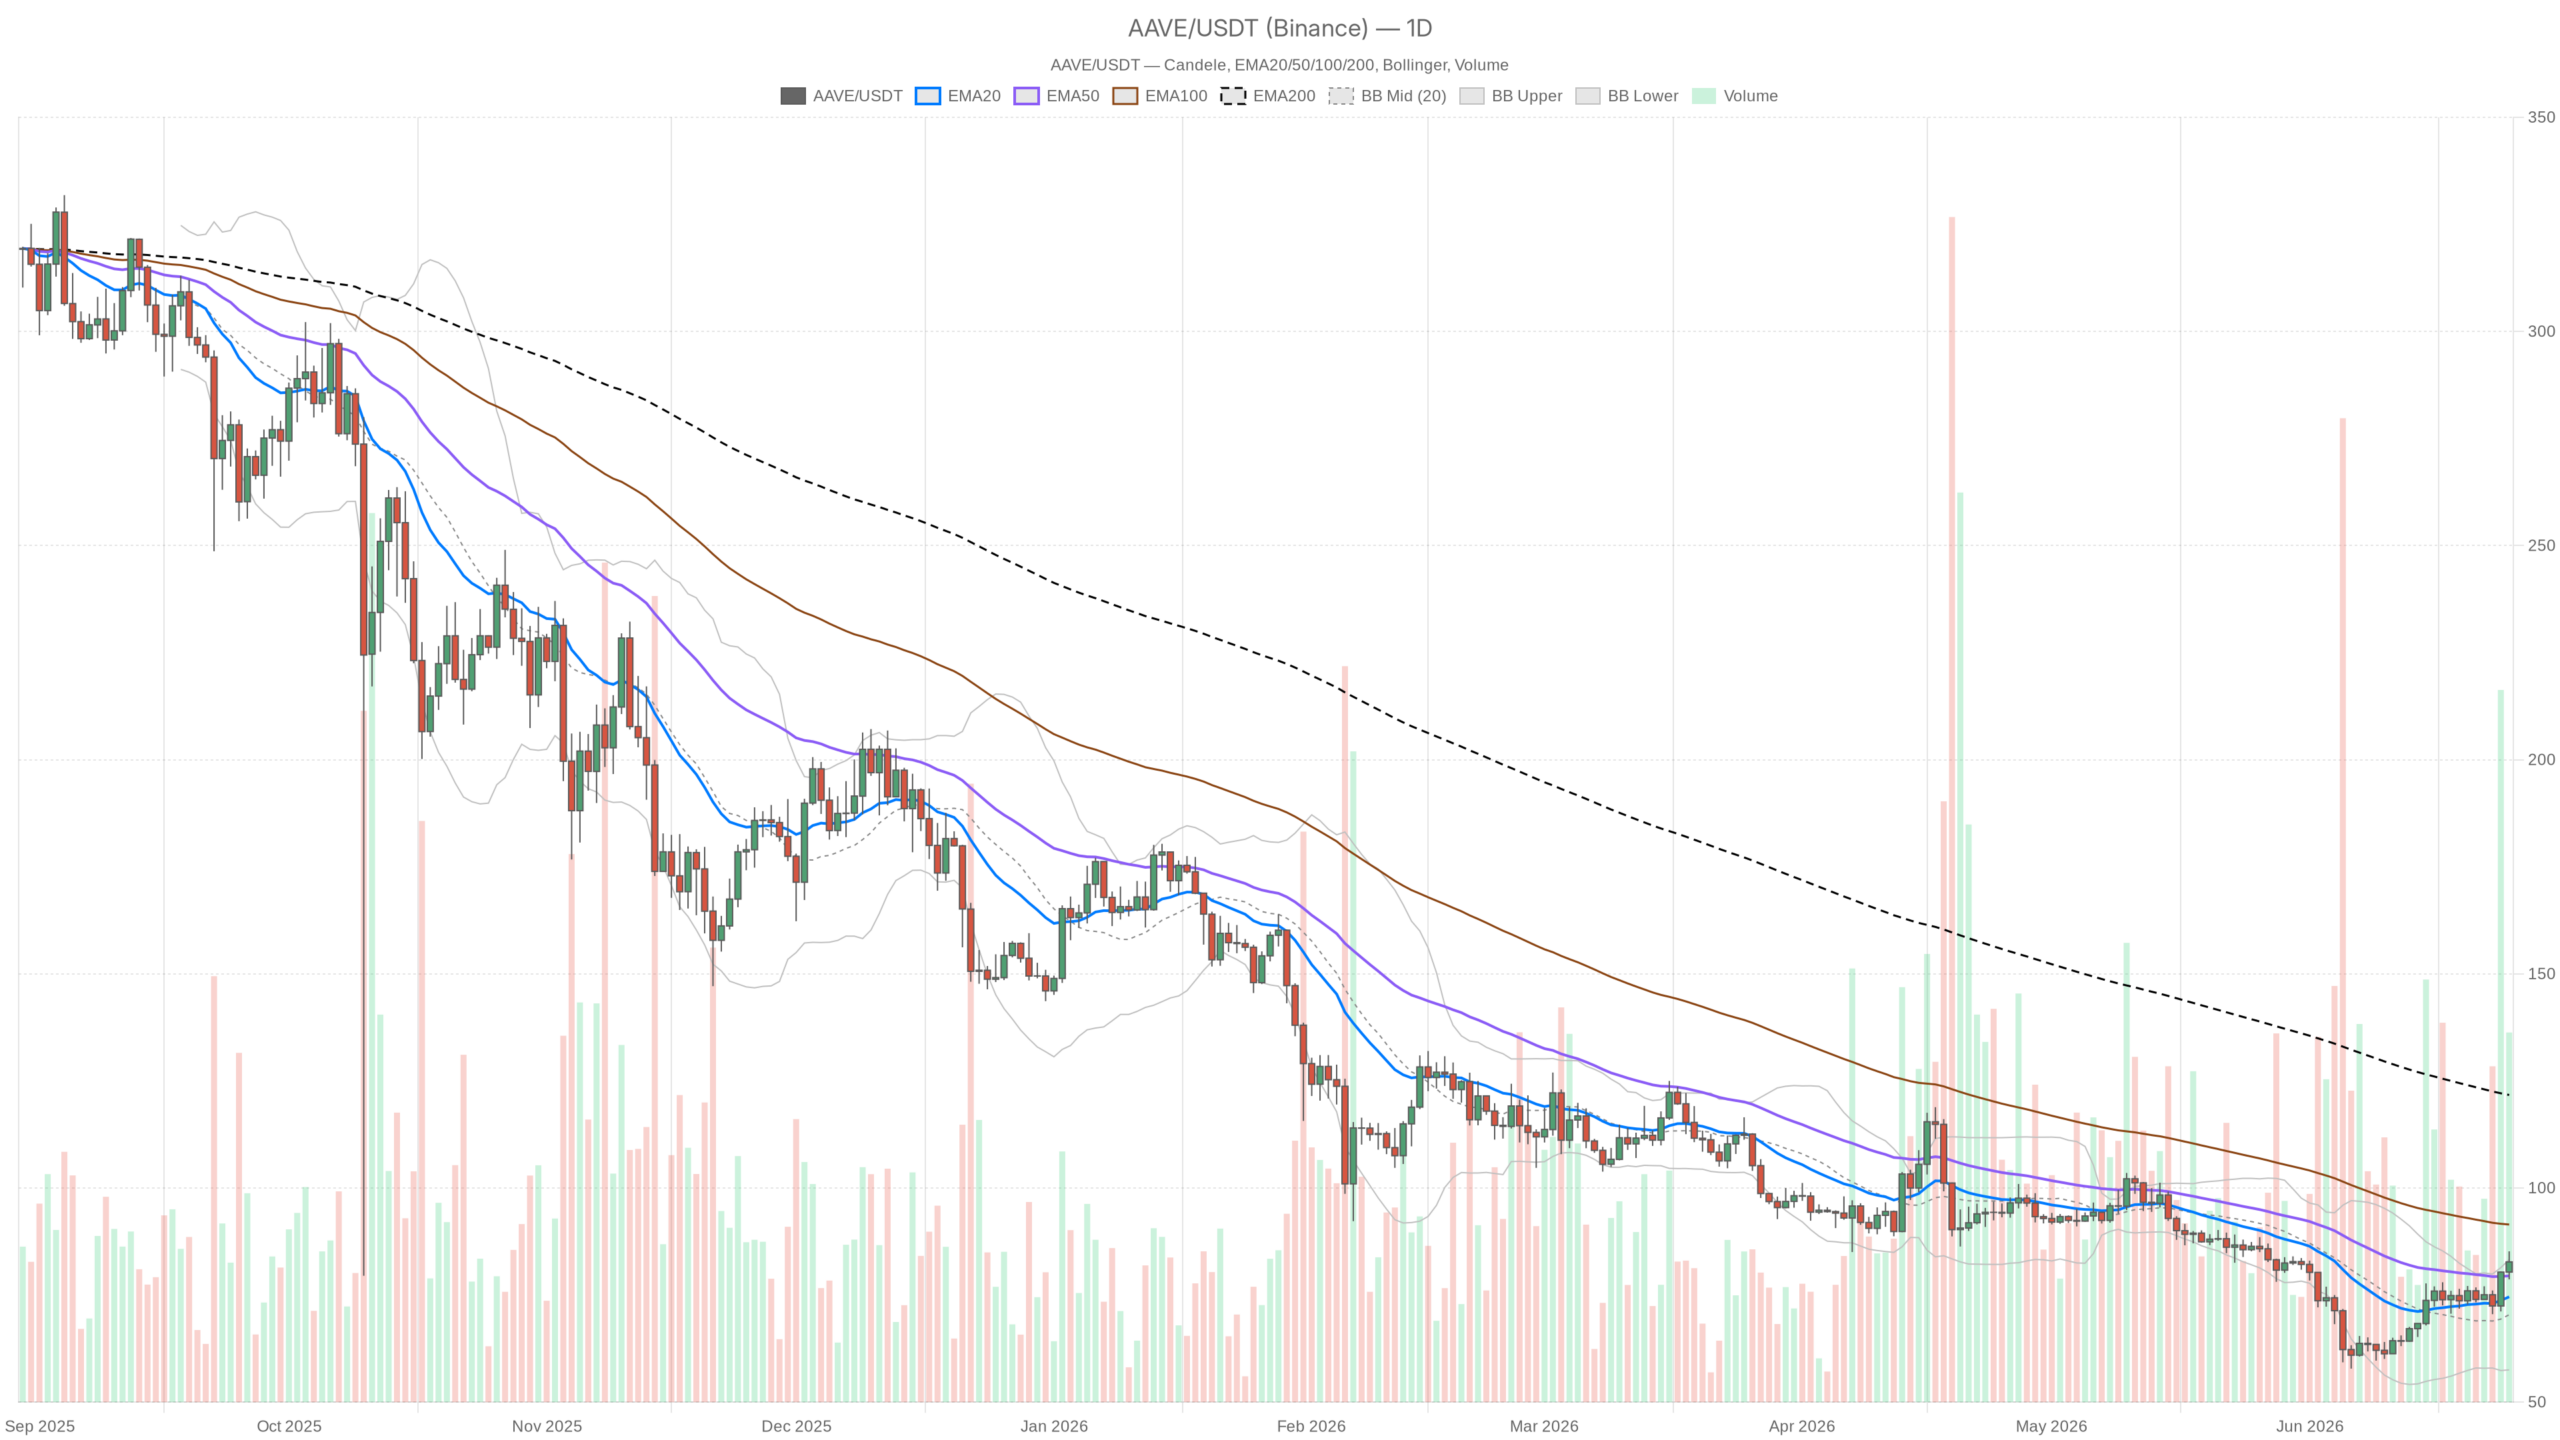
As of June 25, 2026, Aave is trading near $82.74, sitting at a technically interesting junction. The Aave price today reflects a market where short-term momentum favors bulls, but the broader daily picture remains unresolved. This setup means the next 48 to 72 hours carry real weight.
Key takeaways
- $AAVE is trading near $82.74 as of June 25, 2026, with short-term momentum firmly in the hands of bulls
- The daily RSI at 61.69 leaves room for further upside before the asset reaches overbought territory
- The upper daily Bollinger Band at $83.30 is the critical resistance level that must be broken for a confirmed breakout
- A daily close below S1 support at $79.20 would structurally weaken the current recovery setup
- The broader market sits in Extreme Fear at 12 on the Fear & Greed Index, making selective altcoin appetite a key constraint
Daily Timeframe: Recovery in Progress, but the Ceiling Is Real
The daily chart for $AAVE shows a recovery that is structurally intact but facing a genuine ceiling at the upper Bollinger Band near $83.30. The D1 regime is classified as neutral, and that label is honest. $AAVE has recovered meaningfully from deeper lows, with the EMA20 at $74.59 and EMA50 at $79.48 both well below current price. That means the near-to-medium term trend structure has been rebuilt from the ground up over recent weeks. However, what is not constructive is the EMA200 sitting at $121.72. That is not a resistance level nearby — it is a structural scar from the previous bull cycle, and it frames the entire current price action as a recovery, not a new trend.
The daily RSI at 61.69 is in healthy bullish territory without being overbought. There is room to run toward 70 before the asset starts flashing exhaustion signals, which gives bulls a reasonable window if buying pressure sustains. Moreover, the MACD on the daily is doing something worth noting: the line has crossed into positive territory at 0.19, the signal line is still negative at -1.78, and the histogram has expanded to 1.97. That histogram expansion tells the real story — momentum is shifting decisively upward at the daily level, even if the crossover itself is fresh.
The Bollinger Bands on the daily show price pressing right up against the upper band at $83.30. The midline is $70.42. When price trades this far from the midline, one of two things happens: either the bands expand to accommodate a genuine breakout, or price gets rejected and mean-reverts toward the center. With ATR at $5.10, daily candles can cover significant ground quickly. A single bearish session could drag price back to the $77 to $79 zone without anything technically catastrophic happening.
Daily pivot levels confirm the battleground: the pivot point is $82.20, R1 sits at $85.75, and S1 is at $79.20. Price is already above the pivot, which is marginally constructive for the session. That said, the gap between current price and R1 is barely three dollars — not a lot of upside before the next meaningful technical test. S1 at $79.20 is the line in the sand for daily bulls; a close below that level would structurally weaken the current recovery.
The 1-Hour Chart: Bulls Are Actually in Control
On the hourly timeframe, $AAVE displays a textbook bullish alignment with price above all major moving averages, confirming short-term control belongs to buyers. The H1 regime is bullish, and unlike the daily neutral label, this one is supported by a clean EMA stack: price at $82.72 sits above the EMA20 at $79.82, which sits above the EMA50 at $77.07, which sits above the EMA200 at $74.32. That means every significant short-term moving average is sloping upward beneath price, providing layered support.
The hourly RSI at 64.36 mirrors the daily in being elevated but not extreme. Meanwhile, the MACD on this timeframe shows the line at 2.26 above the signal at 2.13, with a histogram of 0.12. The spread is tightening, which is a mild caution flag. When the MACD histogram starts compressing at elevated levels, it often precedes a short-term pullback or consolidation rather than an immediate collapse. Traders riding hourly momentum should be aware the push is maturing, not just beginning.
Hourly pivot levels are tight: PP at $82.42, R1 at $83.51, S1 at $81.64. Price is sandwiched between its own recent highs and a modest support floor. Furthermore, the upper Bollinger Band on H1 is at $85.99, suggesting room exists on the hourly if price can get through the $83.50 R1 pivot zone with conviction.
The 15-Minute Chart: Momentum Is Fading at the Surface
The 15-minute chart reveals that intraday momentum is temporarily stalling, with a micro-bearish MACD cross suggesting a brief consolidation rather than a reversal. The regime remains bullish by classification, with all EMAs aligned — price above EMA20 at $82.16, above EMA50 at $81.01, and well above EMA200 at $77.03. However, the MACD histogram has flipped slightly negative at -0.06, with the line at 0.20 slipping below the signal at 0.25. That is a micro-bearish cross, not alarming at this scale, but it indicates the intraday push has temporarily stalled.
The 15-minute ATR is just $0.83, so any pullback at this granularity is likely to be noise within the larger structure rather than a genuine reversal. The pivot support at $82.57 is the immediate floor to watch for scalpers.
The Bullish Scenario
$AAVE’s bullish scenario hinges on a daily close above the $83.30 upper Bollinger Band, which would signal band expansion and open the path toward the $85.75 R1 target. If $AAVE can hold above the daily pivot at $82.20 and push through that level with conviction, the door opens toward the next resistance zone. A close above $83.30 on the daily would confirm Bollinger Band expansion — a technically significant event that often precedes accelerated moves. Sustaining the hourly EMA stack and seeing the 15-minute MACD flip back positive would confirm re-entry from the short-term stall. In this scenario, the $85 to $86 zone becomes the next meaningful test before the market has to confront deeper structural resistance above $90.
This scenario gets invalidated if daily price closes below $79.20 (S1). That break would imply the upper Bollinger Band rejection played out and the mean-reversion trade toward $70 becomes live.
The Bearish Scenario
The bearish scenario centers on a rejection at the $83.30 upper Bollinger Band, which would likely trigger a mean-reversion pullback toward the $79 to $80 zone. The upper Bollinger Band rejection on the daily is a well-worn pattern, and the macro context of Extreme Fear makes it more, not less, likely. If price gets turned away and the hourly MACD histogram continues compressing, a pullback to the $79 to $80 area is a natural and technically healthy outcome. The daily EMA50 at $79.48 would serve as the first major magnet on the way down. A deeper move toward $74 to $75 is possible if the broader market deteriorates further, but that would require a sustained breakdown, not just a single weak session.
This scenario gets invalidated if $AAVE posts a clean daily close above $83.50 on rising volume, effectively absorbing the Bollinger Band resistance and transitioning into expansion mode.
Positioning and Risk Context
The Aave price today sits at a complex junction where timeframe disagreement makes entries particularly difficult. The daily is neutral with bullish momentum building but not confirmed. The hourly is structurally bullish but showing early signs of fatigue. Meanwhile, the 15-minute has already begun a micro-consolidation. That is not a contradiction — it is a normal stacking of signals where higher timeframes set the stage and lower timeframes time the entries. However, it does mean that chasing price here at the upper Bollinger Band on the daily, into an Extreme Fear market reading, carries asymmetric risk.
The ATR of $5.10 on the daily deserves one final mention: it means a normal daily range for Aave right now is roughly plus or minus five dollars. Anyone holding a position without accounting for that volatility will get shaken out by normal price action. The setup has merit, but it demands discipline. A daily close above $83.30 changes the calculus significantly. Until then, the honest answer is that $AAVE is testing a meaningful resistance zone in a fearful market — and the outcome of that test is genuinely open.
FAQ
What is the Aave price today?
As of June 25, 2026, Aave is trading at approximately $82.74 against $USDT. The price is pressing against the upper daily Bollinger Band at $83.30, which represents the immediate resistance level that traders are watching closely.
What are the key resistance levels for $AAVE right now?
The most immediate resistance is the upper daily Bollinger Band at $83.30. Above that, the daily R1 pivot sits at $85.75, and the hourly upper Bollinger Band is at $85.99. Deeper structural resistance lies at the daily EMA200 at $121.72, though that level is far from current price action.
Is $AAVE bullish or bearish right now?
The technical picture is mixed across timeframes. The daily chart is neutral with bullish momentum building, the hourly chart is structurally bullish with a clean EMA alignment, but the 15-minute chart shows early signs of momentum fatigue. The broader market context of Extreme Fear adds further uncertainty to the outlook.
What would invalidate the bullish scenario for $AAVE?
A daily close below $79.20 (S1 support) would invalidate the bullish scenario, suggesting the upper Bollinger Band rejection has played out and a mean-reversion move toward the $70 zone is underway. On the upside, a clean daily close above $83.50 on rising volume would confirm the breakout.
$AAVE is testing a meaningful resistance zone in a fearful market, and the daily close above $83.30 would change the calculus significantly. That event would confirm Bollinger Band expansion and open the path toward $85.75. Until then, discipline and respect for the $5.10 daily ATR remain essential for anyone holding a position.
Disclaimer: This article is for informational purposes only and does not constitute financial advice, an investment recommendation, or a solicitation to buy or sell any financial instrument or cryptocurrency. The analysis provided is not indicative of future results. Investing in crypto assets and financial markets carries a high risk of capital loss. Always do your own research (DYOR) and consult a qualified financial advisor before making any decision.
Article produced with the assistance of artificial intelligence and reviewed by the editorial team.

