

 1
1
Venice Token [$VVV] fell 11.32% to $13.41 over the last 24 hours at press time, even as trading volume climbed 21.02% to $28.68 million. This highlights growing activity during the token’s price decline.
The increase in participation, however, failed to stabilize price action as sellers maintained control throughout the session. Recent candles pushed $VVV closer to an important support area that has attracted buyers several times before. While volume expanded noticeably, the market did not translate that activity into sustained demand.
Instead, traders appeared to use the increased liquidity to exit positions. As a result, $VVV entered a critical phase where support preservation became more essential than short-term trading activity.
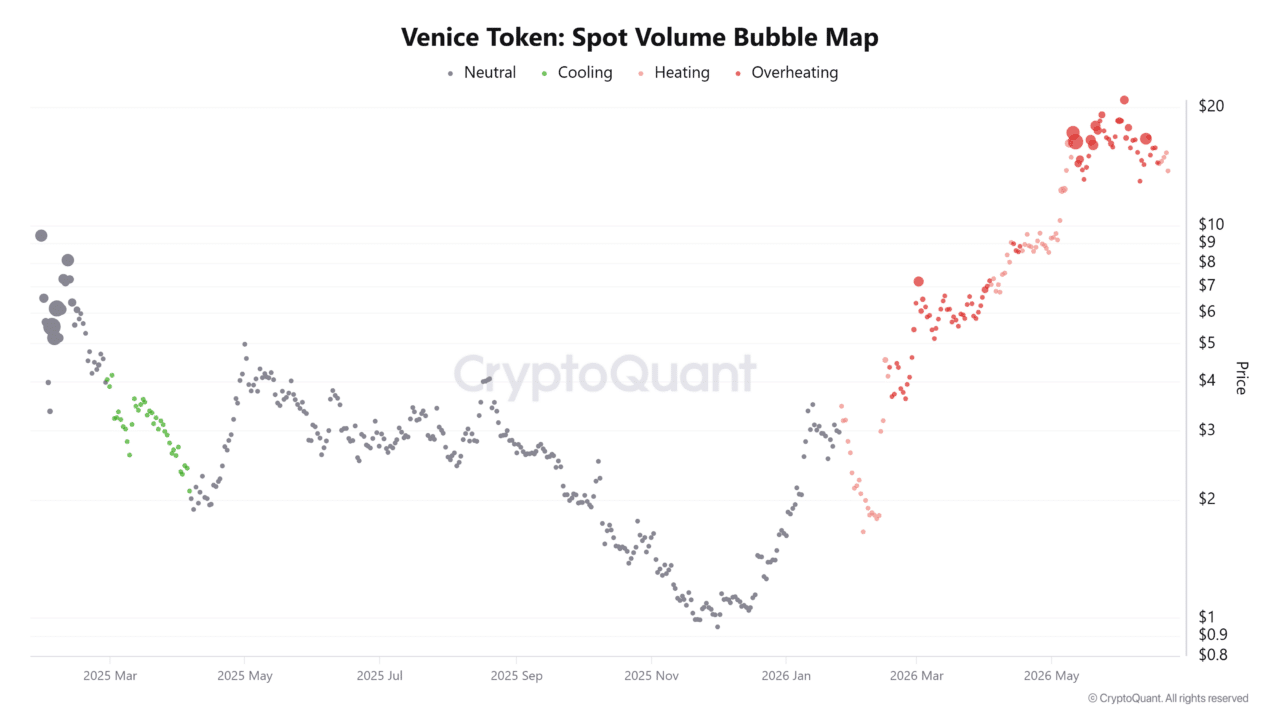
Has $VVV overheated phase finally cooled?
CryptoQuant’s Spot Volume Bubble Map showed that $VVV remained within an overheated zone as of writing, after months of aggressive price appreciation.
Large clusters of elevated trading activity emerged when the token traded between roughly $15 and $20. Those regions historically reflected periods where speculation intensified and traders chased upside moves. However, recent bubbles appeared smaller than those recorded near the peak, indicating that participation gradually cooled as the rally lost strength.
Price also retreated from the overheated region toward lower levels where demand previously emerged. Although overheating conditions remained visible on the broader chart, the latest readings pointed to moderation rather than renewed acceleration.
Therefore, market participants appeared more focused on preserving capital than aggressively pursuing higher prices.
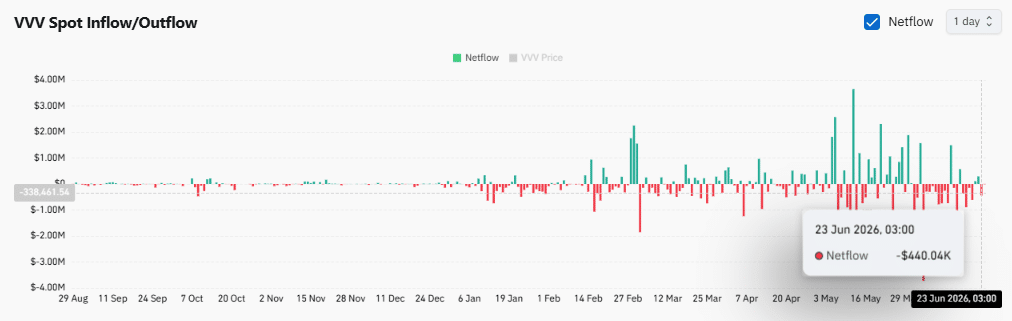
Exchange withdrawals continue despite the decline
At the time of writing, spot flow data revealed that $VVV continued leaving exchanges even as the token experienced a double-digit daily decline. The latest reading showed net outflows of approximately $440,000, extending a broader pattern that emerged throughout recent months.
Several larger outflow spikes also appeared during May and June, reflecting consistent token movement away from trading platforms. Such activity often reduces immediately available exchange supply and can indicate a preference for holding rather than selling. Nevertheless, the continued decline in price showed that outflows alone did not create sufficient buying demand.
Selling pressure still outweighed available bids during the latest correction. Even so, the persistent withdrawal trend suggested that some market participants retained confidence in $VVV despite the ongoing weakness and heightened market uncertainty.
Technical structure tests key support amid bearish momentum
At the time of analysis, $VVV hovered near a critical support zone around $12.87, forming a potential triple-bottom pattern after multiple retests in recent weeks. This level remained pivotal, as repeated defenses suggested underlying demand, though confirmation required a sustained bounce.
Price action stayed below both the 9-day ($14.72) and 21-day ($15.30) Moving Averages, reinforcing short-term bearish momentum and establishing these levels as immediate resistance.
At press time, the MACD further supported this outlook, with the MACD line below the signal line and both positioned under the zero mark, while the histogram printed consistent negative values. These signals indicated continued downside pressure despite attempts at stabilization.
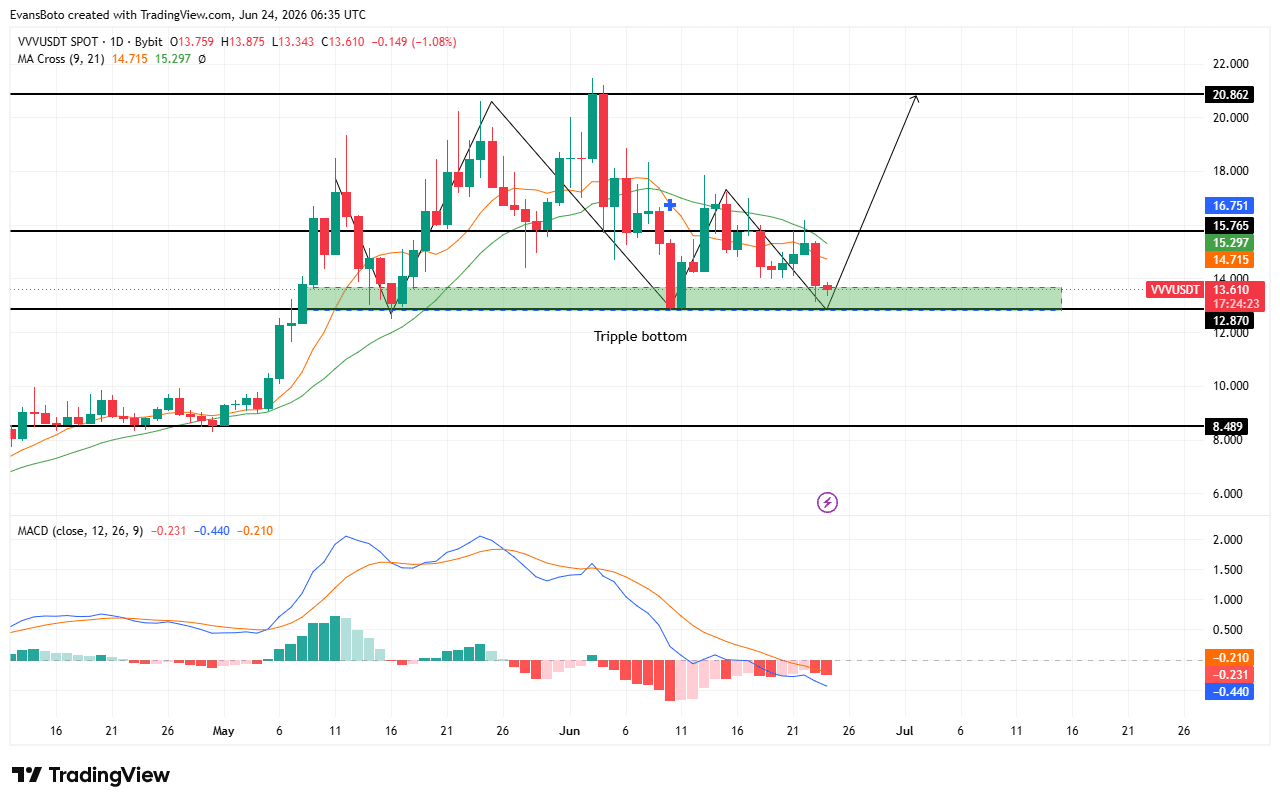
A successful hold above $12.87 could trigger a recovery toward $15.76, while a breakdown would invalidate the pattern and likely accelerate losses toward lower support zones.
Final Summary
- Exchange outflows persist despite weakness, suggesting some holders continue accumulating $VVV.
- Triple-bottom support near $12.87 remains crucial for preventing deeper losses.

