


 7
7
$DEXE has surged as much as 54% to a new yearly high after a technical breakout and a wave of buying activity pushed the token from below $14 to nearly $25 in just a few days.
CoinGecko data shows $DEXE reached an intraday high near $24.12 on June 23 before easing to around $22.50 as traders locked in profits following one of the token’s strongest rallies this year.
Despite the pullback, $DEXE remains roughly 30% higher over the past seven days and has held on to most of its recent gains.
Behind the move sits a combination of market structure and technical factors.
A relatively small amount of $DEXE is actively available for trading, while large portions of the supply remain allocated to ecosystem reserves, treasury holdings, and protocol-controlled wallets.
As fresh demand entered the market, limited sell-side liquidity forced buyers to bid increasingly higher prices.
Short sellers also added fuel to the advance. As key resistance levels gave way, traders betting against the token were forced to close positions, creating additional buying pressure that accelerated the move toward yearly highs.
Double-bottom breakout sparked the rally
On the four-hour chart, $DEXE first established a double-bottom formation near the $14 region after testing the area twice during June.
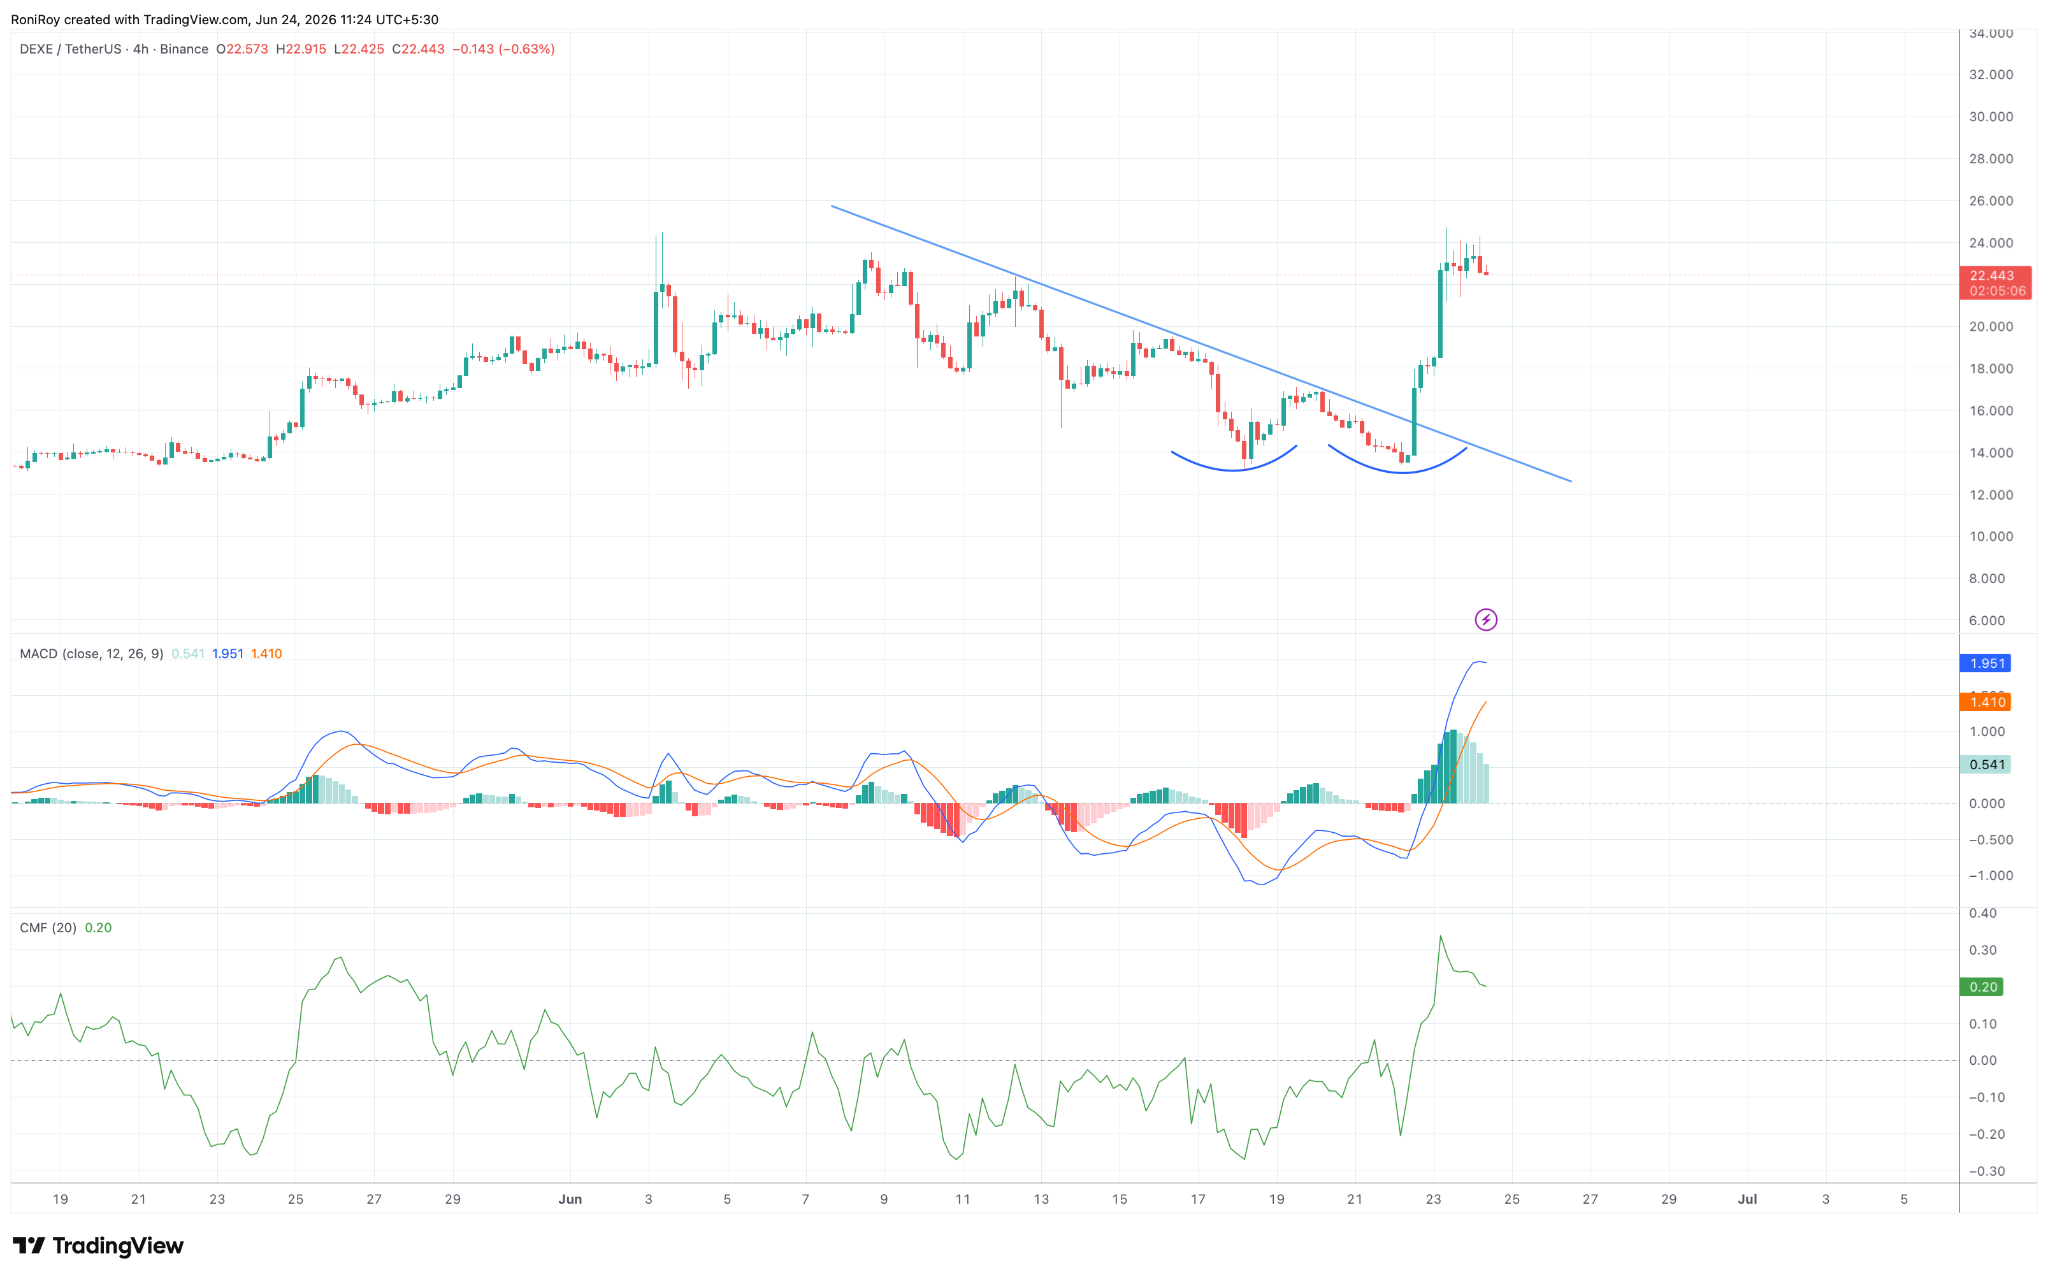
$DEXE/$USDT 4-hour price chart. Source: TradingView.
At the same time, a descending trendline that had guided the token lower since early June continued to cap recovery attempts.
Buyers eventually pushed through that trendline before reclaiming horizontal resistance around $17.12 to $18.
The breakout changed market structure and opened the door for a rapid repricing higher.
Momentum indicators strengthened alongside the move.
The MACD formed a bullish crossover while the Chaikin Money Flow indicator moved above zero, signaling fresh capital entering the asset as the breakout unfolded.
Price quickly advanced toward the $24.85 area, which coincides with $DEXE's previous yearly high and a major Fibonacci retracement level visible on higher timeframes.
$DEXE price analysis: Is the rally over?
Recent price action suggests the explosive phase of the rally has cooled, but the technicals do not yet point to a complete trend reversal.
Over the past 24 hours, $DEXE has traded largely between $22.50 and $23.50 after reaching its local peak.
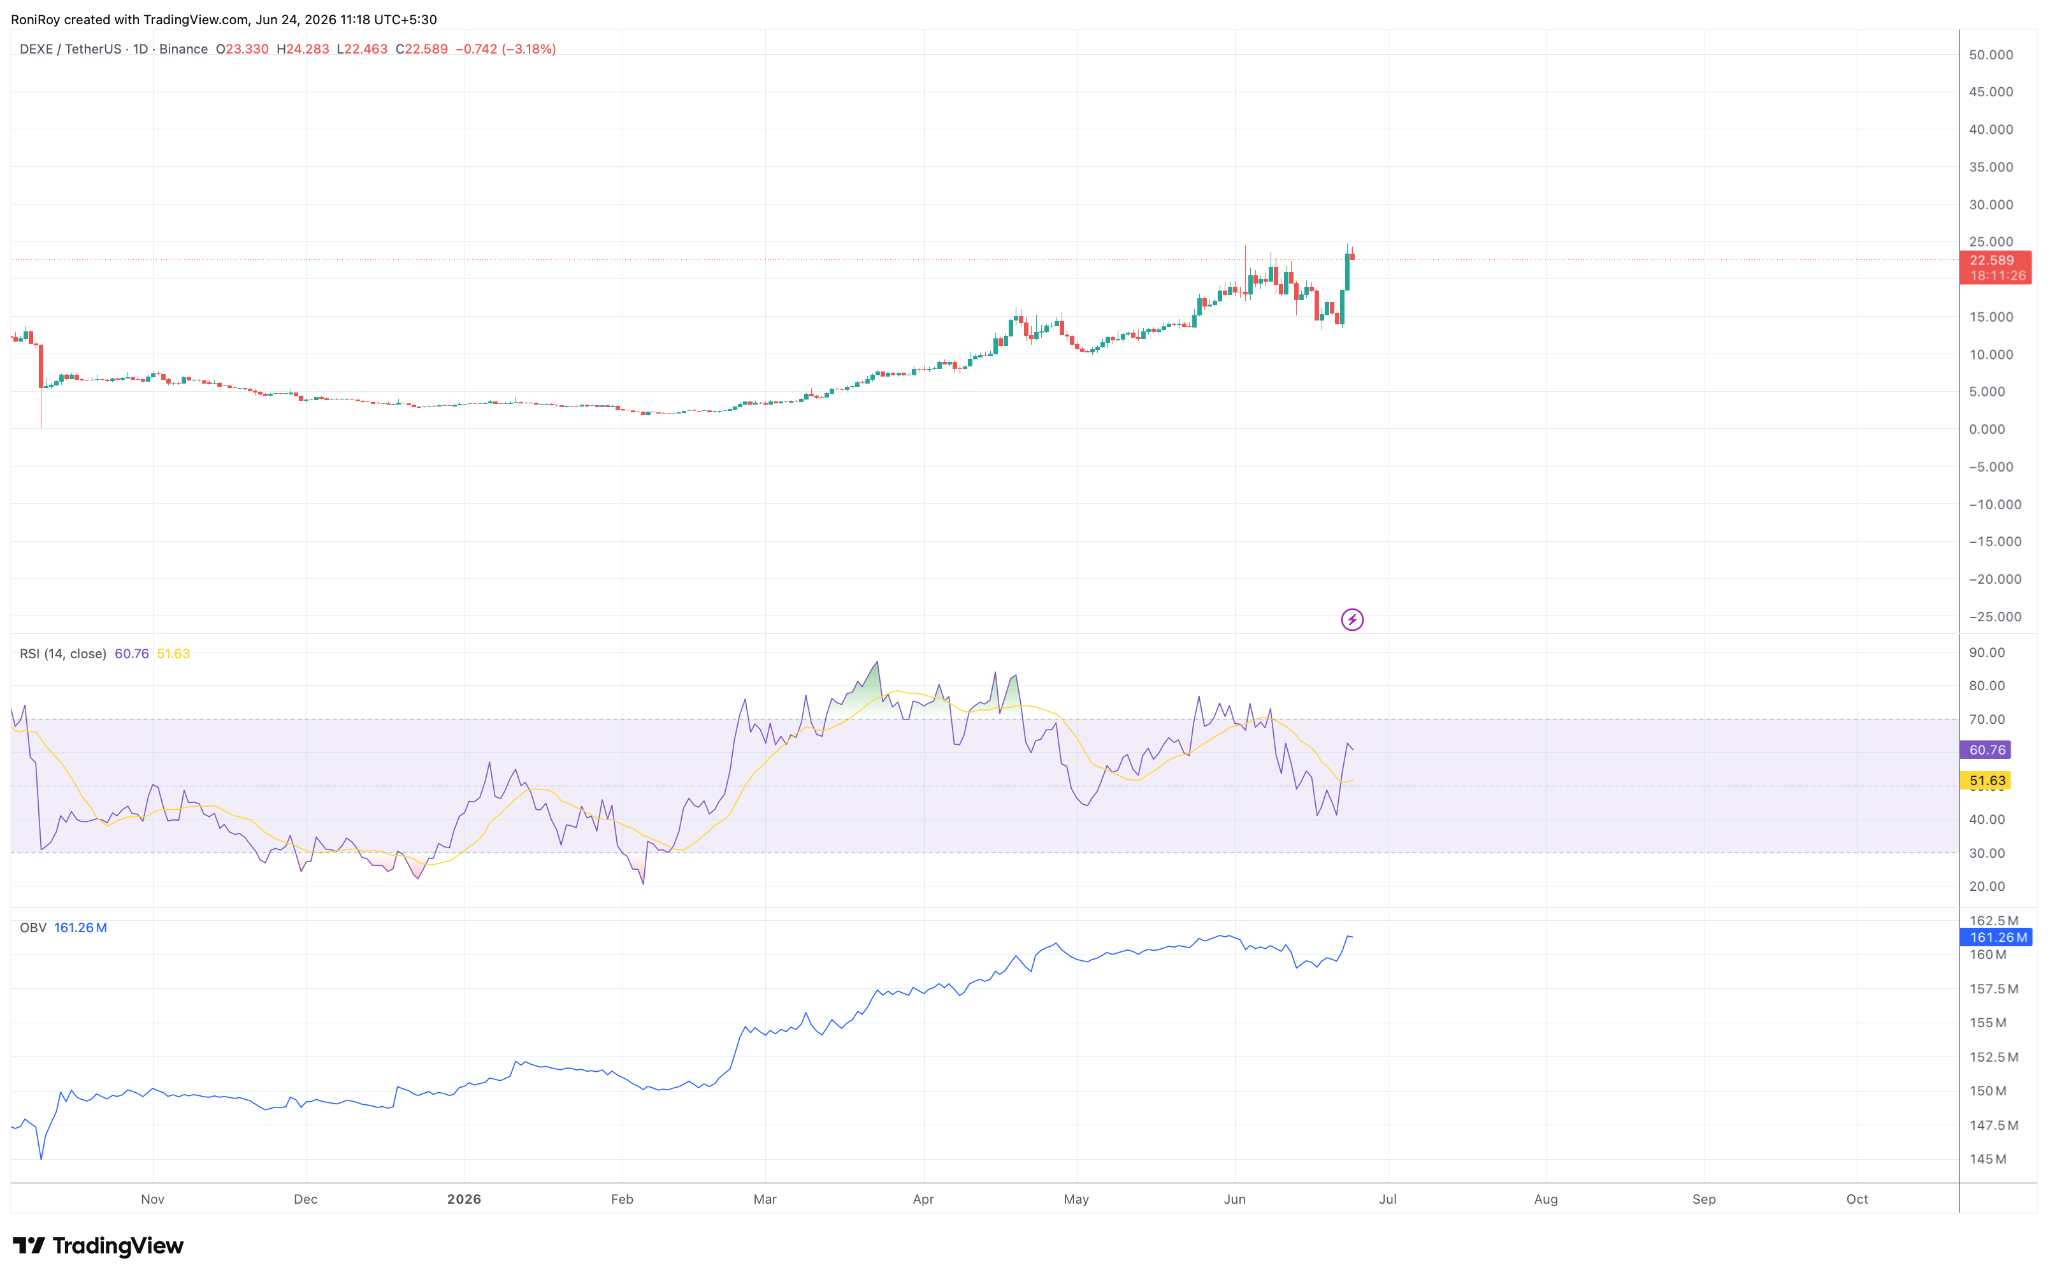
$DEXE/$USDT 1-day price chart. Source: TradingView.
Rather than extending vertically higher, the token has entered a consolidation range just below resistance near $25.
Daily chart indicators continue to favor buyers. The Relative Strength Index has recovered to around 60, placing it above the neutral 50 level while remaining below the overbought threshold of 70.
Such positioning often indicates bullish momentum remains intact without reaching the kind of extremes that frequently accompany major tops.
Meanwhile $DEXE’s On-Balance Volume has climbed to a new local high, suggesting buying activity continued to accompany the advance instead of fading once the breakout occurred.
Support levels also remain well below current prices.
$DEXE continues to trade comfortably above the former breakout zone near $17 to $18, an area that previously acted as resistance before being reclaimed during the rally.
At the time of publication, the charts suggest momentum has slowed rather than reversed.
The double-bottom breakout remains valid, daily momentum indicators have yet to enter overheated territory, and volume trends continue to support the move.
As long as buyers defend the breakout structure, traders are likely to keep watching the $24.85 to $25 region for signs of another attempt at fresh yearly highs.

