

 1
1
Avalanche [$AVAX] dipped 9.50% on the 19th of June. This bearish outlook appears to be driven by ongoing geopolitical tensions, the broader market trend, and the breakdown of a major support level.
At press time, $AVAX tanked 9.50% over the past 24 hours and was trading at $6.07. Despite the sharp price decline, the asset’s trading volume recorded a sudden spike, indicating strong participation from market participants.
This surge in activity suggests that traders are actively following the current trend, further reinforcing $AVAX’s bearish momentum.
The decline was likely influenced by the postponement of U.S.-Iran talks following fresh attacks in Lebanon, which turned the crypto market down 2.66%.
$AVAX chart signals more pain ahead
According to TradingView’s daily chart, today’s 9.50% decline has extended $AVAX’s bearish trend for a third consecutive day. In fact, this drop triggered a breakdown below the key $6.24 support level, which had acted as a major floor since the 6th of June.
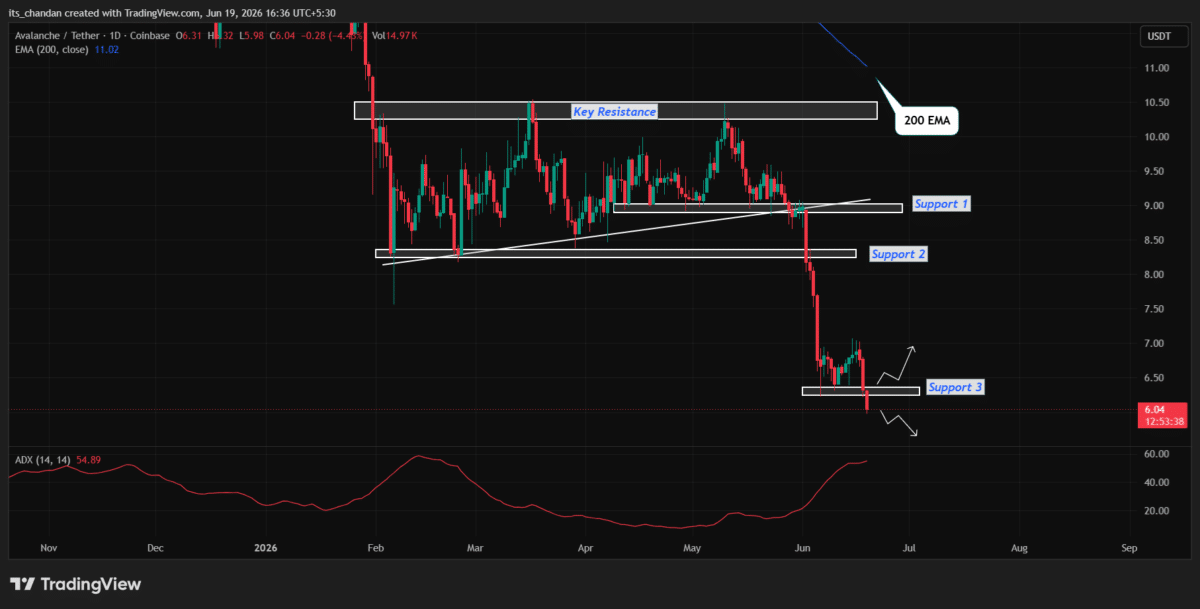
Besides this, $AVAX’s broader trend appears bearish due to the persistent breakdown of key support levels at $8.95, $8.21, and now $6.24.
In addition, the price trading below the 200-day Exponential Moving Average (EMA) indicates that the asset remains in a strong bearish trend, with sellers firmly in control.
Based on the current price action, if $AVAX continues its current trend and remains below the $6.24 level, it could witness further downside in the coming days.
However, a potential recovery would only become likely if the price reclaims the $6.24 level; otherwise, the bearish trend is expected to continue.
At press time, $AVAX’s Average Directional Index (ADX) stood at 54.89, well above the key threshold of 25, indicating a strong directional trend in the asset.
Traders and investors’ mixed sentiment
Not only has $AVAX’s market structure turned bearish, but trader sentiment has also followed the same path, as market participants appear to be betting on further downside.
Derivatives data from CoinGlass shows that $AVAX’s Long/Short Ratio has fallen to 0.8709, indicating strong bearish sentiment among traders.
Meanwhile, Open Interest (OI) has jumped 2.31% to $261.78 million, suggesting that bears are actively building positions, further reinforcing the possibility of additional downside in the coming days.
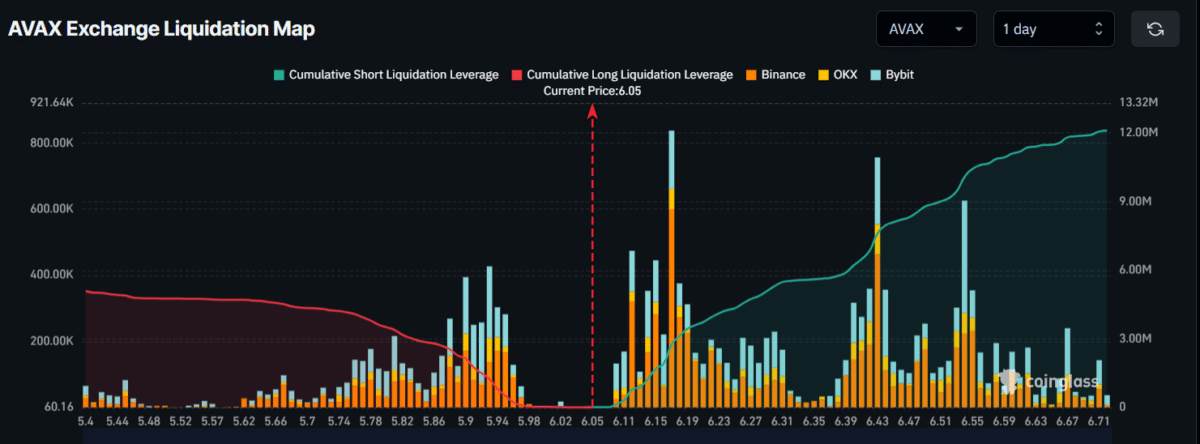
As of now, $5.93 on the downside and $6.17 on the upside are the major liquidation levels.
Traders have built $1.24 million worth of long positions at the lower level and $2.75 million worth of short positions at the upper level, indicating that bears are currently dominating the market while bulls appear to be losing momentum.
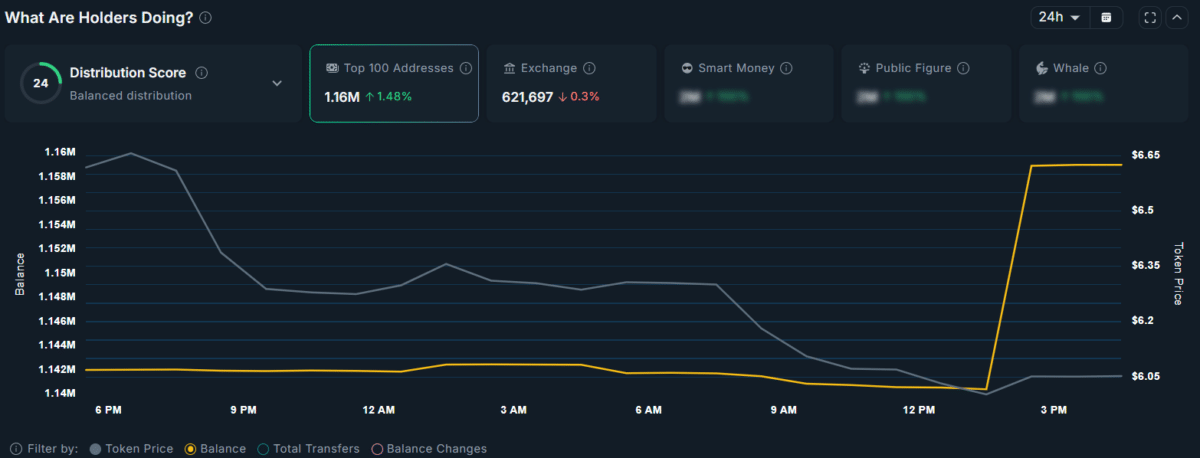
However, on-chain analytics paints a slightly different picture. Data from Nansen shows that the top 100 $AVAX addresses have increased their holdings by 1.47%, indicating potential accumulation during the recent price dip.
At the same time, exchange reserves have fallen by 0.30%, suggesting that not only are top holders taking advantage of the decline, but long-term investors are also following the same approach.
Final Summary
- $AVAX plunged 9.50%, losing a major key support level, with the chart signaling the possibility of further downside ahead.
- Traders and investors appear to have mixed sentiment, as traders are betting on price declines, while investors seem to be taking advantage of the dip.