

 4
4
Market data suggests that the latest $XRP decline had more to do with activity in the derivatives market than with investors selling their $XRP on the spot market.
After climbing to around $1.29 earlier this week, $XRP has lost more than 13% of its value and slipped to roughly $1.12. While most traders would attribute this drop to spot selling, the data shows that the leveraged traders had the bigger contribution.
$XRP Open Interest and CVD See Sharp Declines
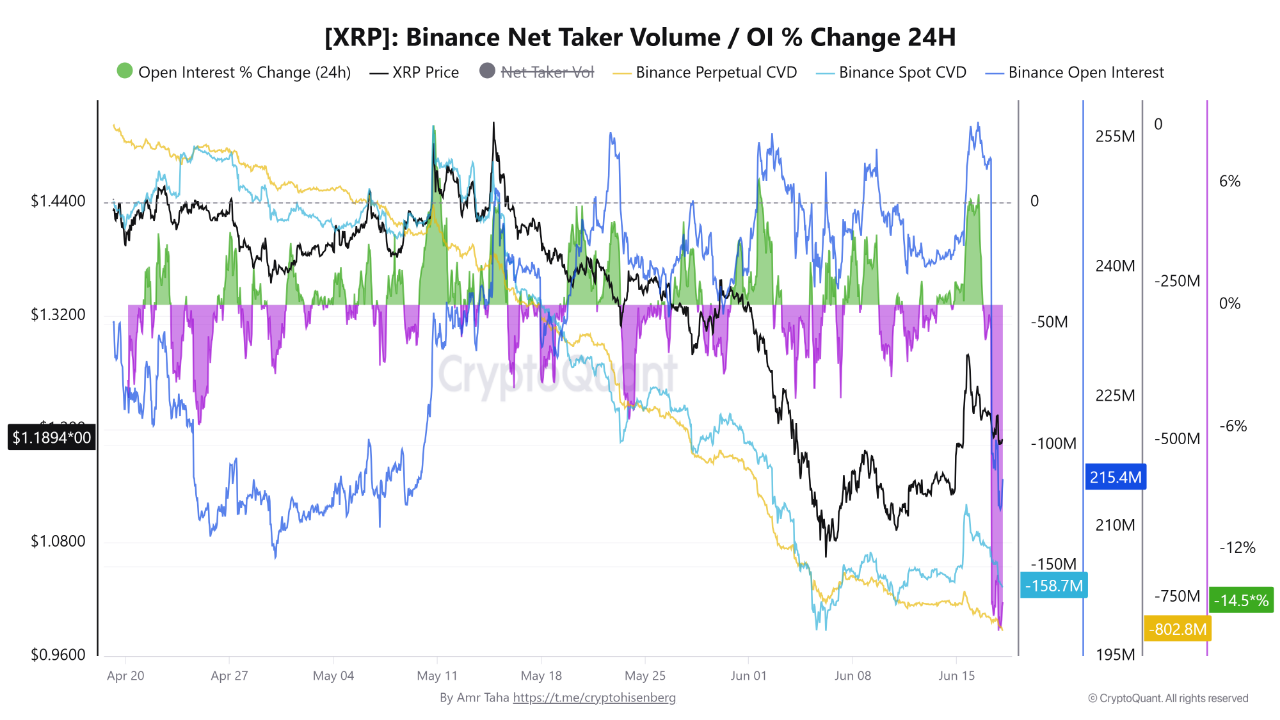
One of the indicators suggesting this is the Binance Open Interest (OI). For context, open interest measures the total value of active futures and perpetual contracts, and traders often use it to track the level of speculative activity in the market.
According to the data sourced from CryptoQuant, Binance OI fell from about 255 million to 215.4 million within 24 hours, marking a decline of 14.5%.
When open interest drops alongside price, it usually means traders are closing positions either by choice or through forced liquidations in a process called deleveraging or leverage unwinding. This suggests that many leveraged long positions were pushed out of the market as $XRP moved lower.
Further evidence comes from Binance Perpetual CVD (Cumulative Volume Delta). Notably, this indicator measures the difference between aggressive buying and aggressive selling in the perpetual futures market.
During $XRP’s decline, the metric dropped to -802.8 million, showing that sellers heavily outweighed buyers in futures trading. The move indicates that leveraged traders aggressively sold into the market as prices weakened.
As a result, much of the downward pressure seems to have come from futures traders closing positions rather than from long-term investors exiting $XRP.
$XRP Spot Market Selling Relatively Light
Meanwhile, the Binance Spot CVD did not experience as much decline as the futures CVD and OI. Specifically, the indicator declined to around -158.7 million, a much smaller drop than the one recorded in the perpetual futures market.
Notably, if investors had been rushing to sell their $XRP holdings, spot-market selling would likely have been much closer to the scale of the futures-market activity. However, the data shows that spot selling remained relatively limited while derivatives traders drove most of the decline.
When spot-market selling drives a decline, it can indicate that investors are losing confidence and distributing their holdings. Such conditions often lead to more extended downtrends.
However, a decline caused mainly by liquidations and falling open interest can look very different. Once leveraged traders have been forced out, much of the selling pressure may disappear because the forced sellers are no longer active.
This does not necessarily mean $XRP has already found a bottom. However, it does suggest that the market may be moving toward a healthier structure after clearing out excessive leverage.
Signals to Watch Going Forward
Right now, the first thing to monitor is whether open interest stabilizes around the current level.
If OI stops falling while $XRP maintains support, it could indicate that the liquidation phase is nearing its end. On the other hand, continued declines in OI may suggest that more leveraged positions still need to be cleared out.
Further, the Spot CVD is extremely important. So far, the decline in Spot CVD is much smaller than the move seen in futures markets.
If this metric stays relatively stable, it confirms that leverage unwinding caused the drop. However, a sharp increase in spot selling would point to broader investor selling and could create additional downside risks.
Investors should also watch Perpetual CVD after its fall to -802.8 million. A recovery in this indicator would show that aggressive futures buyers are returning to the market.


