

 3
3
A prominent market analyst who correctly predicted the recent $XRP rebound to $1.26 has now mentioned what traders should expect next.
$XRP recently recovered from its yearly low of $1.05, joining the broader crypto market resurgence. This rebound helped $XRP climb to a high of $1.29 on June 15. However, after reaching that level, buying pressure weakened as the asset faced resistance.
As $XRP enters a period of uncertainty, well-regarded analyst EGRAG Crypto, who accurately projected $XRP’s recent rebound, says the next move will depend on how the asset reacts around several important support and resistance levels.
$XRP Followed Previous Forecast Step by Step
In his latest analysis, EGRAG pointed out that the roadmap he presented earlier played out almost exactly as expected.
His previous outlook discussed three important price levels. First, he argued that $XRP first needed to hold the $1.14 support zone to open the door for a retest of $1.1938. If the asset managed to break above $1.1938, the next target would be $1.2600.
However, he confirmed that $XRP was still at risk of a steeper drop. On the downside, EGRAG warned that a break below $1.09 could send prices back toward $1.05.
According to the analyst, $XRP respected the structure throughout the recovery. Specifically, the price successfully held the key $1.14 support area before advancing toward $1.1938.
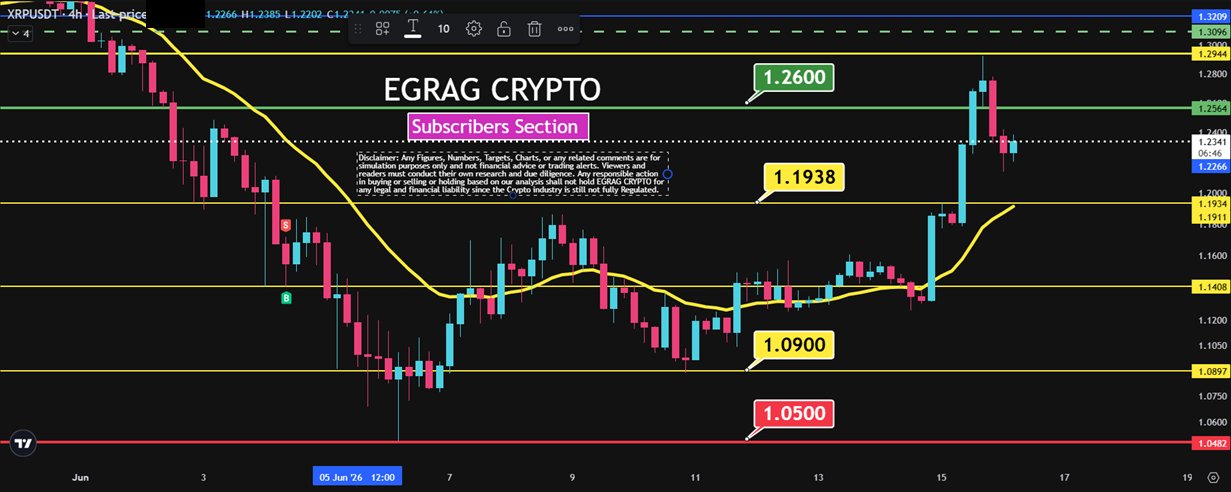
After reaching that level, $XRP moved above it and climbed toward the next projected target. The rally eventually pushed beyond the $1.2600 objective, with $XRP reaching a high of $1.2996, where it faced a roadblock.
$XRP Faces Its Next Test
Although $XRP achieved the projected targets, the asset has started to show signs of rejection after reaching the $1.2600 area. EGRAG explained that this is common after a strong upward move and does not automatically signal a trend reversal.
However, he stressed that the market has now entered a critical phase. He believes that $XRP must continue holding above $1.19 to keep its bullish structure intact. As long as the price remains above that level, the recovery trend stays in place.
If $XRP falls below $1.19, the market could revisit lower support levels. A deeper decline below $1.14 would weaken the structure further and raise concerns about the strength of the rebound.
Additional Support and Resistance Levels
Meanwhile, another market analyst, Chart Nerd, pointed out that, during the recent rebound effort, $XRP tested its daily 50-day exponential moving average, which currently sits at $1.28.
The asset touched that level but failed to move higher, leading to the rejection that followed. At the same time, the daily 20-day exponential moving average near $1.20 has started acting as support.
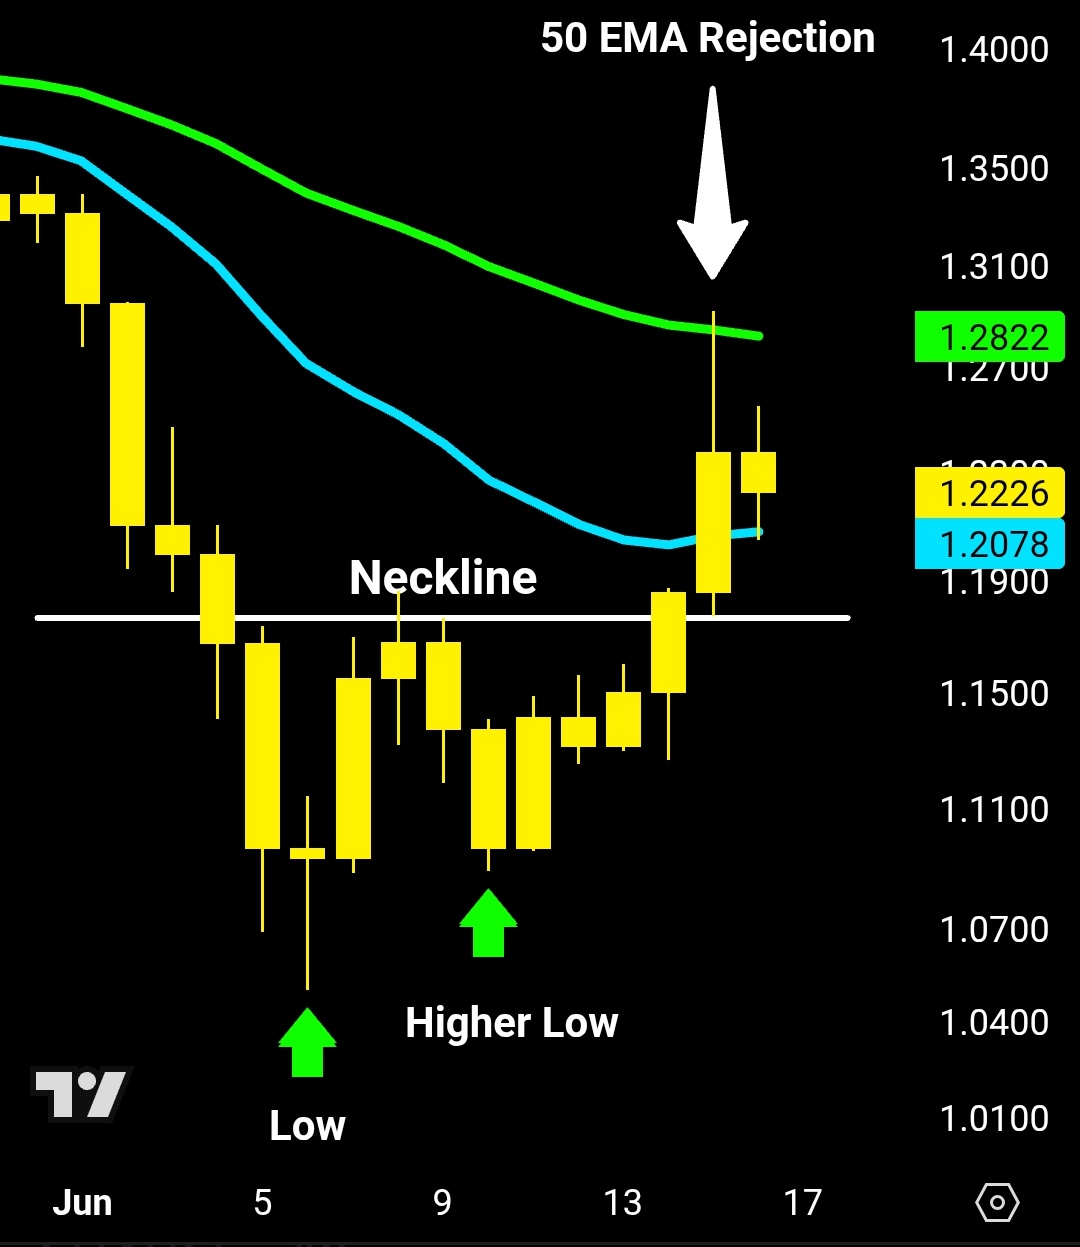
Chart Nerd also highlighted the neckline of a double-bottom pattern as another important support zone if $XRP experiences a deeper pullback. He believes this level could provide a strong area for buyers to step in and support the market.
However, he warned that losing that support could increase selling pressure and potentially send $XRP back toward the $1 level.
Despite that risk, Chart Nerd suggested that if support continues to hold and the current trend remains intact, $XRP may be moving through a wave-four correction before making a final wave-five advance. If this happens, the asset could revisit the $1.40 highs before entering a larger corrective phase.