

 2
2
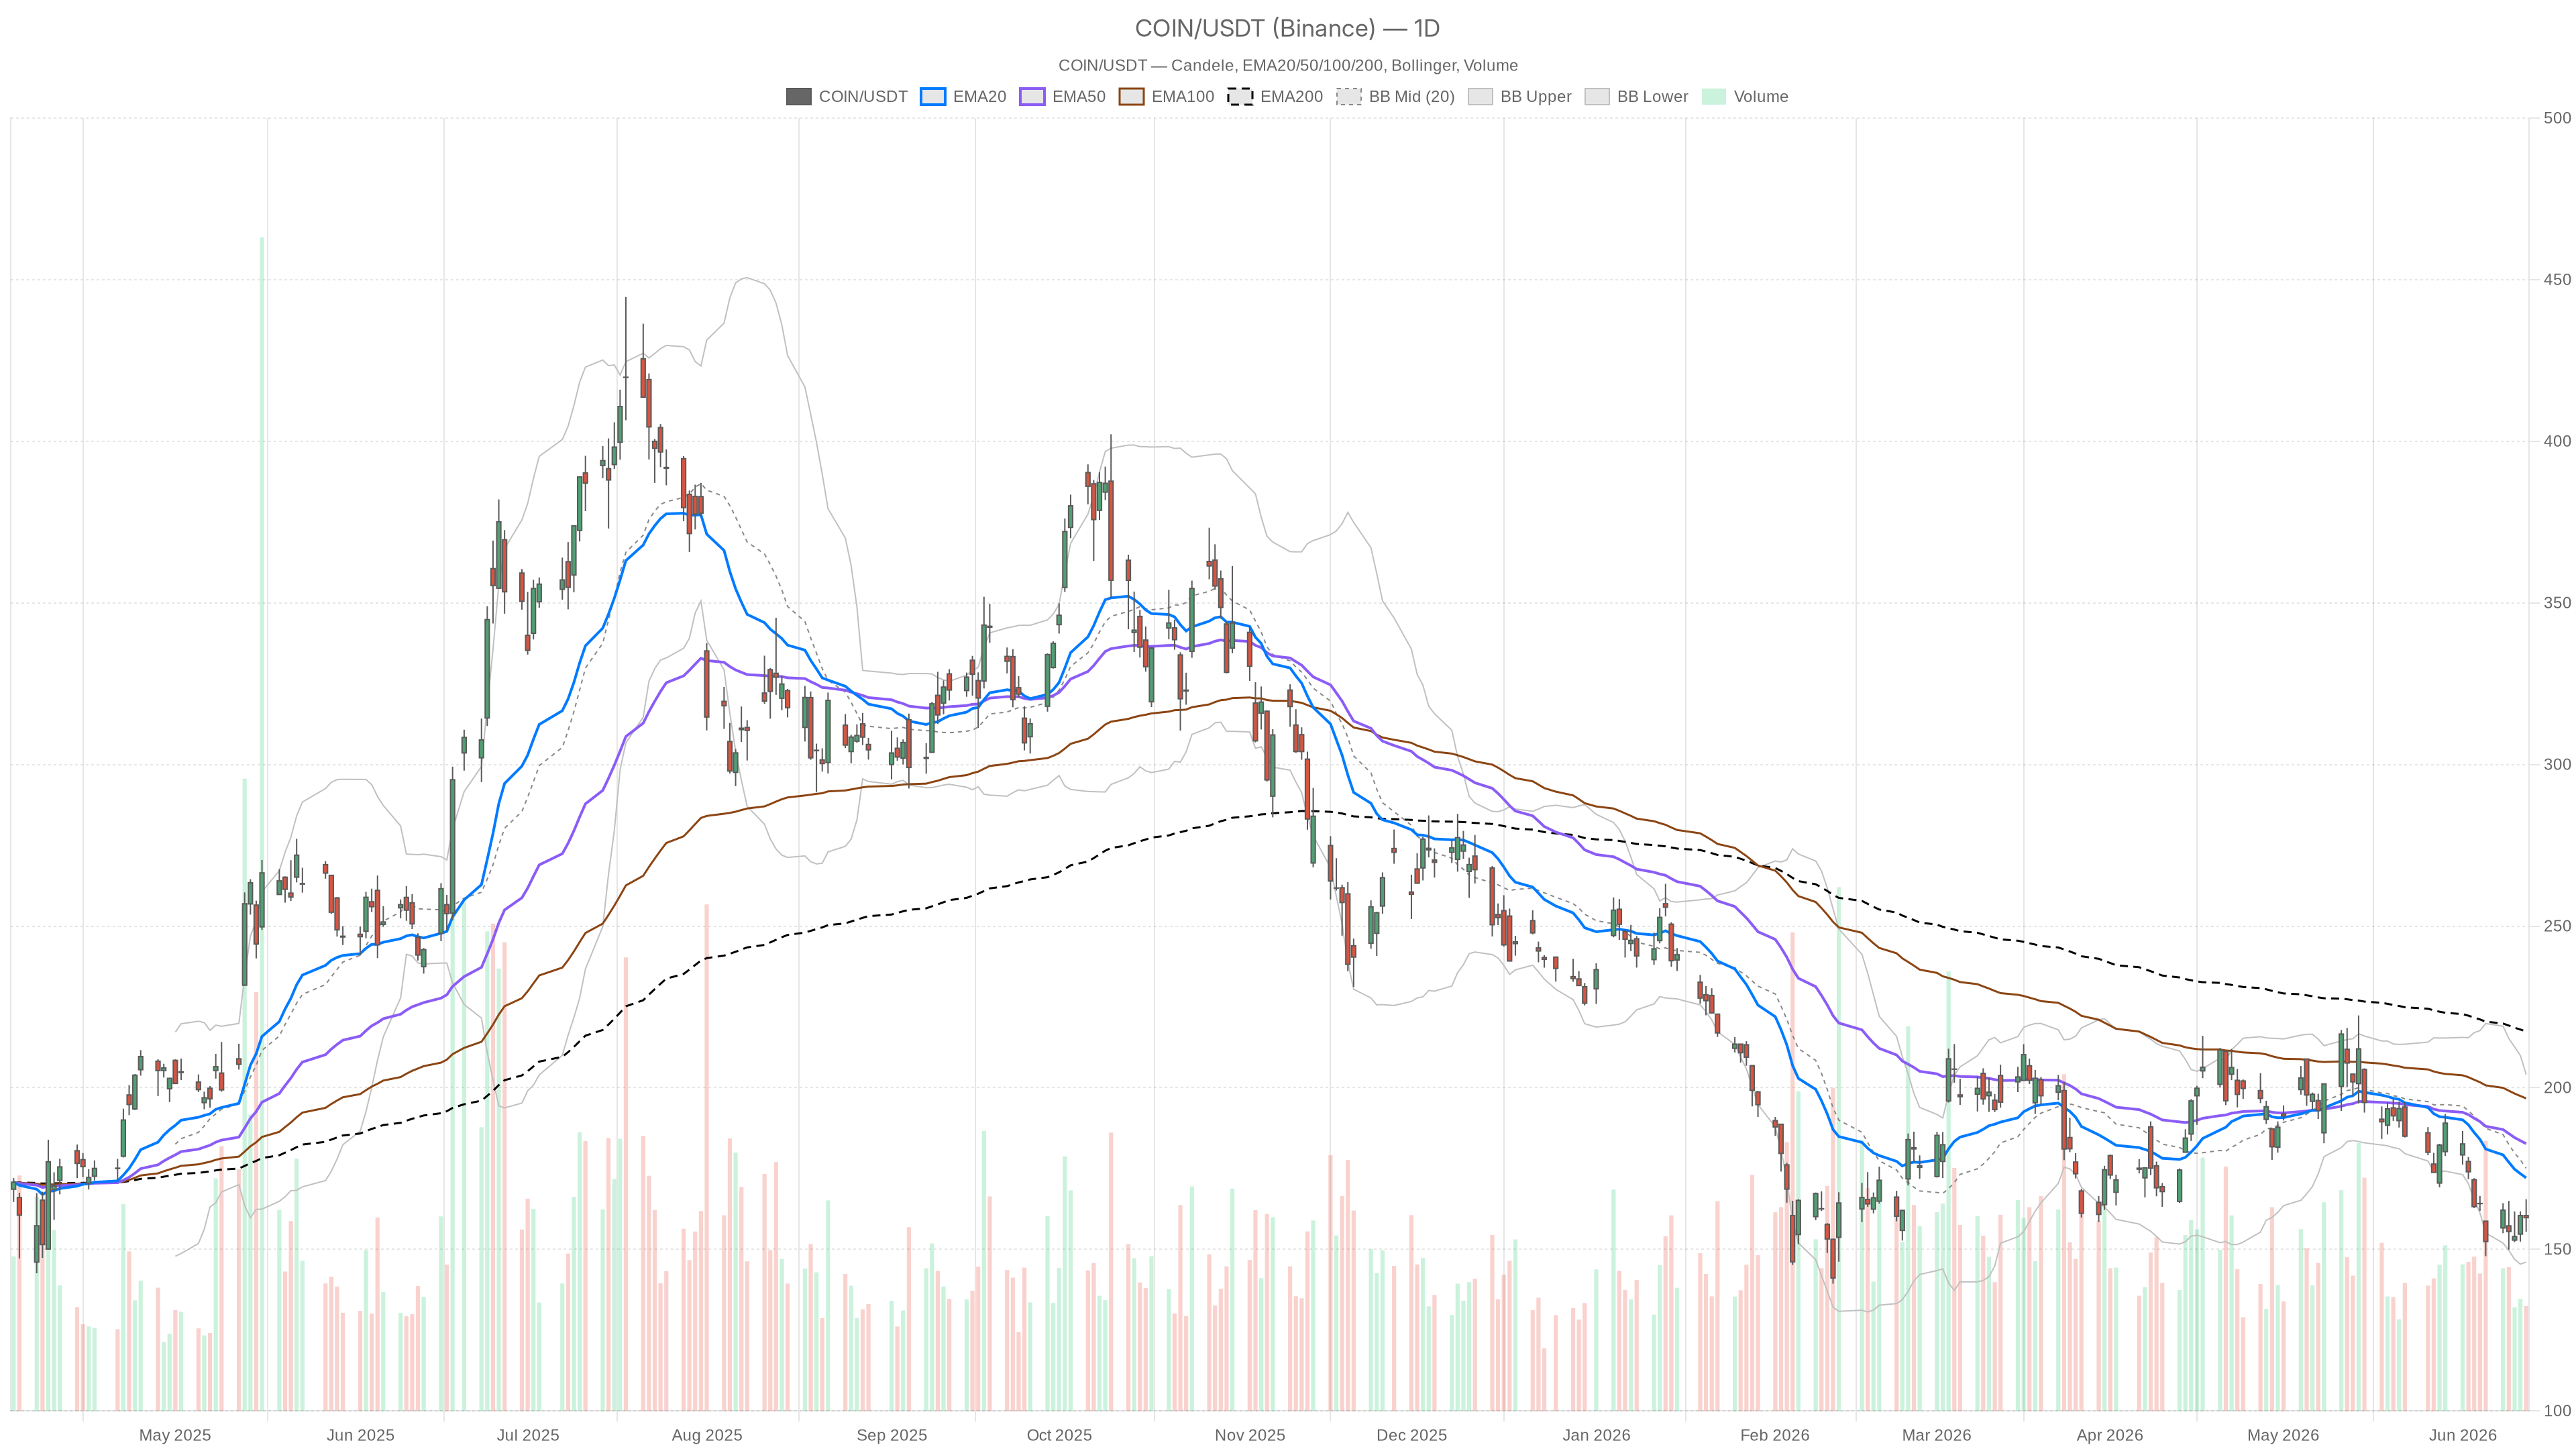
Coinbase shares are trading around 159.78 dollars, in a delicate technical phase. The daily picture is bearish, with the price below all the main moving averages. The company has announced the launch of Coinbase for Agents, an AI agent tool. The catalyst is relevant, but it has not yet changed the structure of the chart.
Key points
- COIN is trading at $159.78, below EMA20 ($172.10), EMA50 ($182.67) and EMA200 ($217.41): bearish trend confirmed on all time horizons.
- Daily RSI at 40.3: clear weakness but without oversold, the downside potential remains open.
- Daily MACD with histogram at -1.85 and increasing divergence: no bullish crossover on the horizon.
- Daily pivot point at $160.23: reclaiming it is the first technical step towards stabilization.
- Hourly timeframe neutral but fragile; the 15-minute chart already shows the first signs of the rebound giving way.
Daily structure: sellers still in full control
The daily picture leaves no room for doubt. Coinbase shares remain under the full control of sellers. The stock is pressed below the EMA20 at 172.10, the EMA50 at 182.67 and the EMA200 at 217.41. The bearish alignment of the three averages indicates the absence of nearby dynamic supports. The medium-term trend is negative and does not yet show signs of exhaustion.
The RSI at 40.3 confirms the weakness without yet touching the oversold area. There is room for further downside before reaching levels where selling pressure is exhausted. Buyers, for now, are not reacting convincingly.
MACD and Bollinger: no reversal signal
Momentum indicators confirm the downward pressure without offering any reversal signal. The daily MACD shows the main line at -9.64 and the signal at -7.79, with a negative histogram at -1.85. The divergence is increasing, not shrinking. As long as the MACD remains in this configuration, any recovery should be interpreted as a technical rebound within a downtrend.
The Bollinger Bands place the price between the middle band at 175.07 and the lower band at 146.05. The stock has slipped below the middle band and is approaching the lower area. The ATR at 10.95 dollars indicates significant daily volatility, which amplifies risk on both sides.
The daily pivot levels define the current critical area. The pivot point is at 160.23, with R1 at 165.04 and S1 at 154.97. The price is just below the pivot. Reclaiming and consolidating above 160.23 would be the first sign of stabilization, but without volumes it remains a level that is hard to defend.
Hourly timeframe: a fragile breather
On the one-hour chart, a stabilization attempt can be glimpsed, but a credible directional structure is still missing. The technical regime is neutral, with mixed signals. The hourly EMA20 at 159.03 and EMA50 at 161.04 enclose the price in a no man’s land. There is no strength, but also no immediate capitulation.
The hourly MACD offers a different reading: line at 0.65 and signal at 0.18, with a positive histogram at 0.47. In the recent session there was an upward push. The RSI at 51.91 is neutral, just above balance. The hourly timeframe shows a market trying to catch its breath after daily pressure, without however building directionality.
The hourly Bollinger Bands have the upper band at 163.78 and the lower band at 152.45. The price is moving in the central area. R1 of the hourly pivot is at 161.17, a threshold that the stock has not yet clearly broken. As long as COIN remains below that level, the recovery attempt remains fragile.
The short term reveals the fatigue of the rebound
The 15-minute timeframe shows that the recovery attempt is already tiring. The MACD has entered negative territory, with a histogram at -0.16. The RSI at 47.48 has slipped below neutrality. The 15-minute EMA200 is at 161.12, above the current price of 159.73, and acts as a nearby dynamic resistance.
The 15-minute pivot has S1 at 159.25, a level that the price is already touching. If that threshold were to give way, the path would open towards 158.21, corresponding to the lower Bollinger Band on the same timeframe. The ATR of 1.03 dollars indicates contained moves but sufficient to test nearby supports quickly.
What would be needed for a bullish reversal
To truly change the picture, at least three technical conditions are needed, all of which are currently absent. The first is a convincing recovery of the daily pivot at 160.23, with a candle close above the threshold and confirmation in the next session. The second is a bullish MACD crossover on the daily chart, which is currently not even close. The third is the return of the daily RSI above 50, a level that would certify the return of institutional buyers.
On the target front, daily R1 at 165.04 represents the first real recovery objective. Only above that threshold would the technical picture begin to differ from a simple rebound within a negative trend. The catalyst linked to Coinbase for Agents could accelerate the scenario, but it must first translate into sustained volumes.
Bearish scenario: levels to monitor
The bearish scenario appears more consistent with current data and is the one the market is already describing. If the price loses daily S1 at 154.97, the technical structure deteriorates further. The lower Bollinger Band on the daily chart is at 146.05. With an increasingly negative MACD and an RSI that does not rebound, that area would become a realistic target.
On the hourly timeframe, losing 158.99 — S1 of the 1H pivot — would invalidate the ongoing recovery attempt. It would mean that even short-term momentum, the only partially positive element today, is giving way. The picture would return entirely to the hands of sellers on all three timeframes.
The critical area between 155 and 161 dollars
The real battleground lies in the range between 155 and 161 dollars. Here the daily pivot, the hourly EMA20 and the 15-minute EMA200 converge. This is no coincidence: professional traders know this area well and are watching it closely.
The tension between timeframes is evident. The daily chart is unambiguously bearish. The hourly chart is trying to build a neutral-positive structure. The 15-minute chart already shows the first signs of weakness. Historically, in these configurations, the structural long-term pressure prevails over short-term rebounds that lack volume.
The launch of the AI agent tool reinforces the narrative of Coinbase as an infrastructure of the crypto market. But news alone does not reverse a trend: real flows are needed. As long as the price does not return stably above 165 dollars with increasing volumes, any bullish reading remains premature.
FAQ
What does it mean that COIN is below all the main EMAs?
The current price is below the EMA20 ($172.10), EMA50 ($182.67) and EMA200 ($217.41). This configuration describes a consolidated bearish trend across all time horizons. In practice, there are no nearby dynamic supports on which the price can rely for a rebound.
Can the AI catalyst reverse the bearish trend?
On its own, no. The launch of Coinbase for Agents is relevant for the long-term narrative, but news does not reverse technical trends. A regime change requires real volumes and the reconquest of key levels, starting from the daily pivot at $160.23 and, later, from R1 at $165.04.
What is the first level to monitor for a recovery?
The first level is the daily pivot point at $160.23. A close above this threshold, confirmed in the next session, would represent the initial technical signal of stabilization. Without this step, any upward move remains a technical rebound within a negative trend.
Why is the area between 155 and 161 dollars considered critical?
In that range, three technical references converge: the daily pivot point, the hourly EMA20 and the 15-minute EMA200. It is the point where traders gauge the possibility of a reversal or, conversely, of a new bearish acceleration towards S1 at $154.97 and the lower Bollinger Band at $146.05.
Disclaimer: This article is for informational purposes only and does not constitute financial advice, investment recommendation or a solicitation to buy or sell financial instruments or cryptocurrencies. The analyses do not guarantee future results. Investments in crypto-assets and financial markets involve a high risk of capital loss. Always do your own research (DYOR) and consult a qualified financial advisor before making any decision.
Content created with the assistance of artificial intelligence and with human editorial review.
