

 5
5
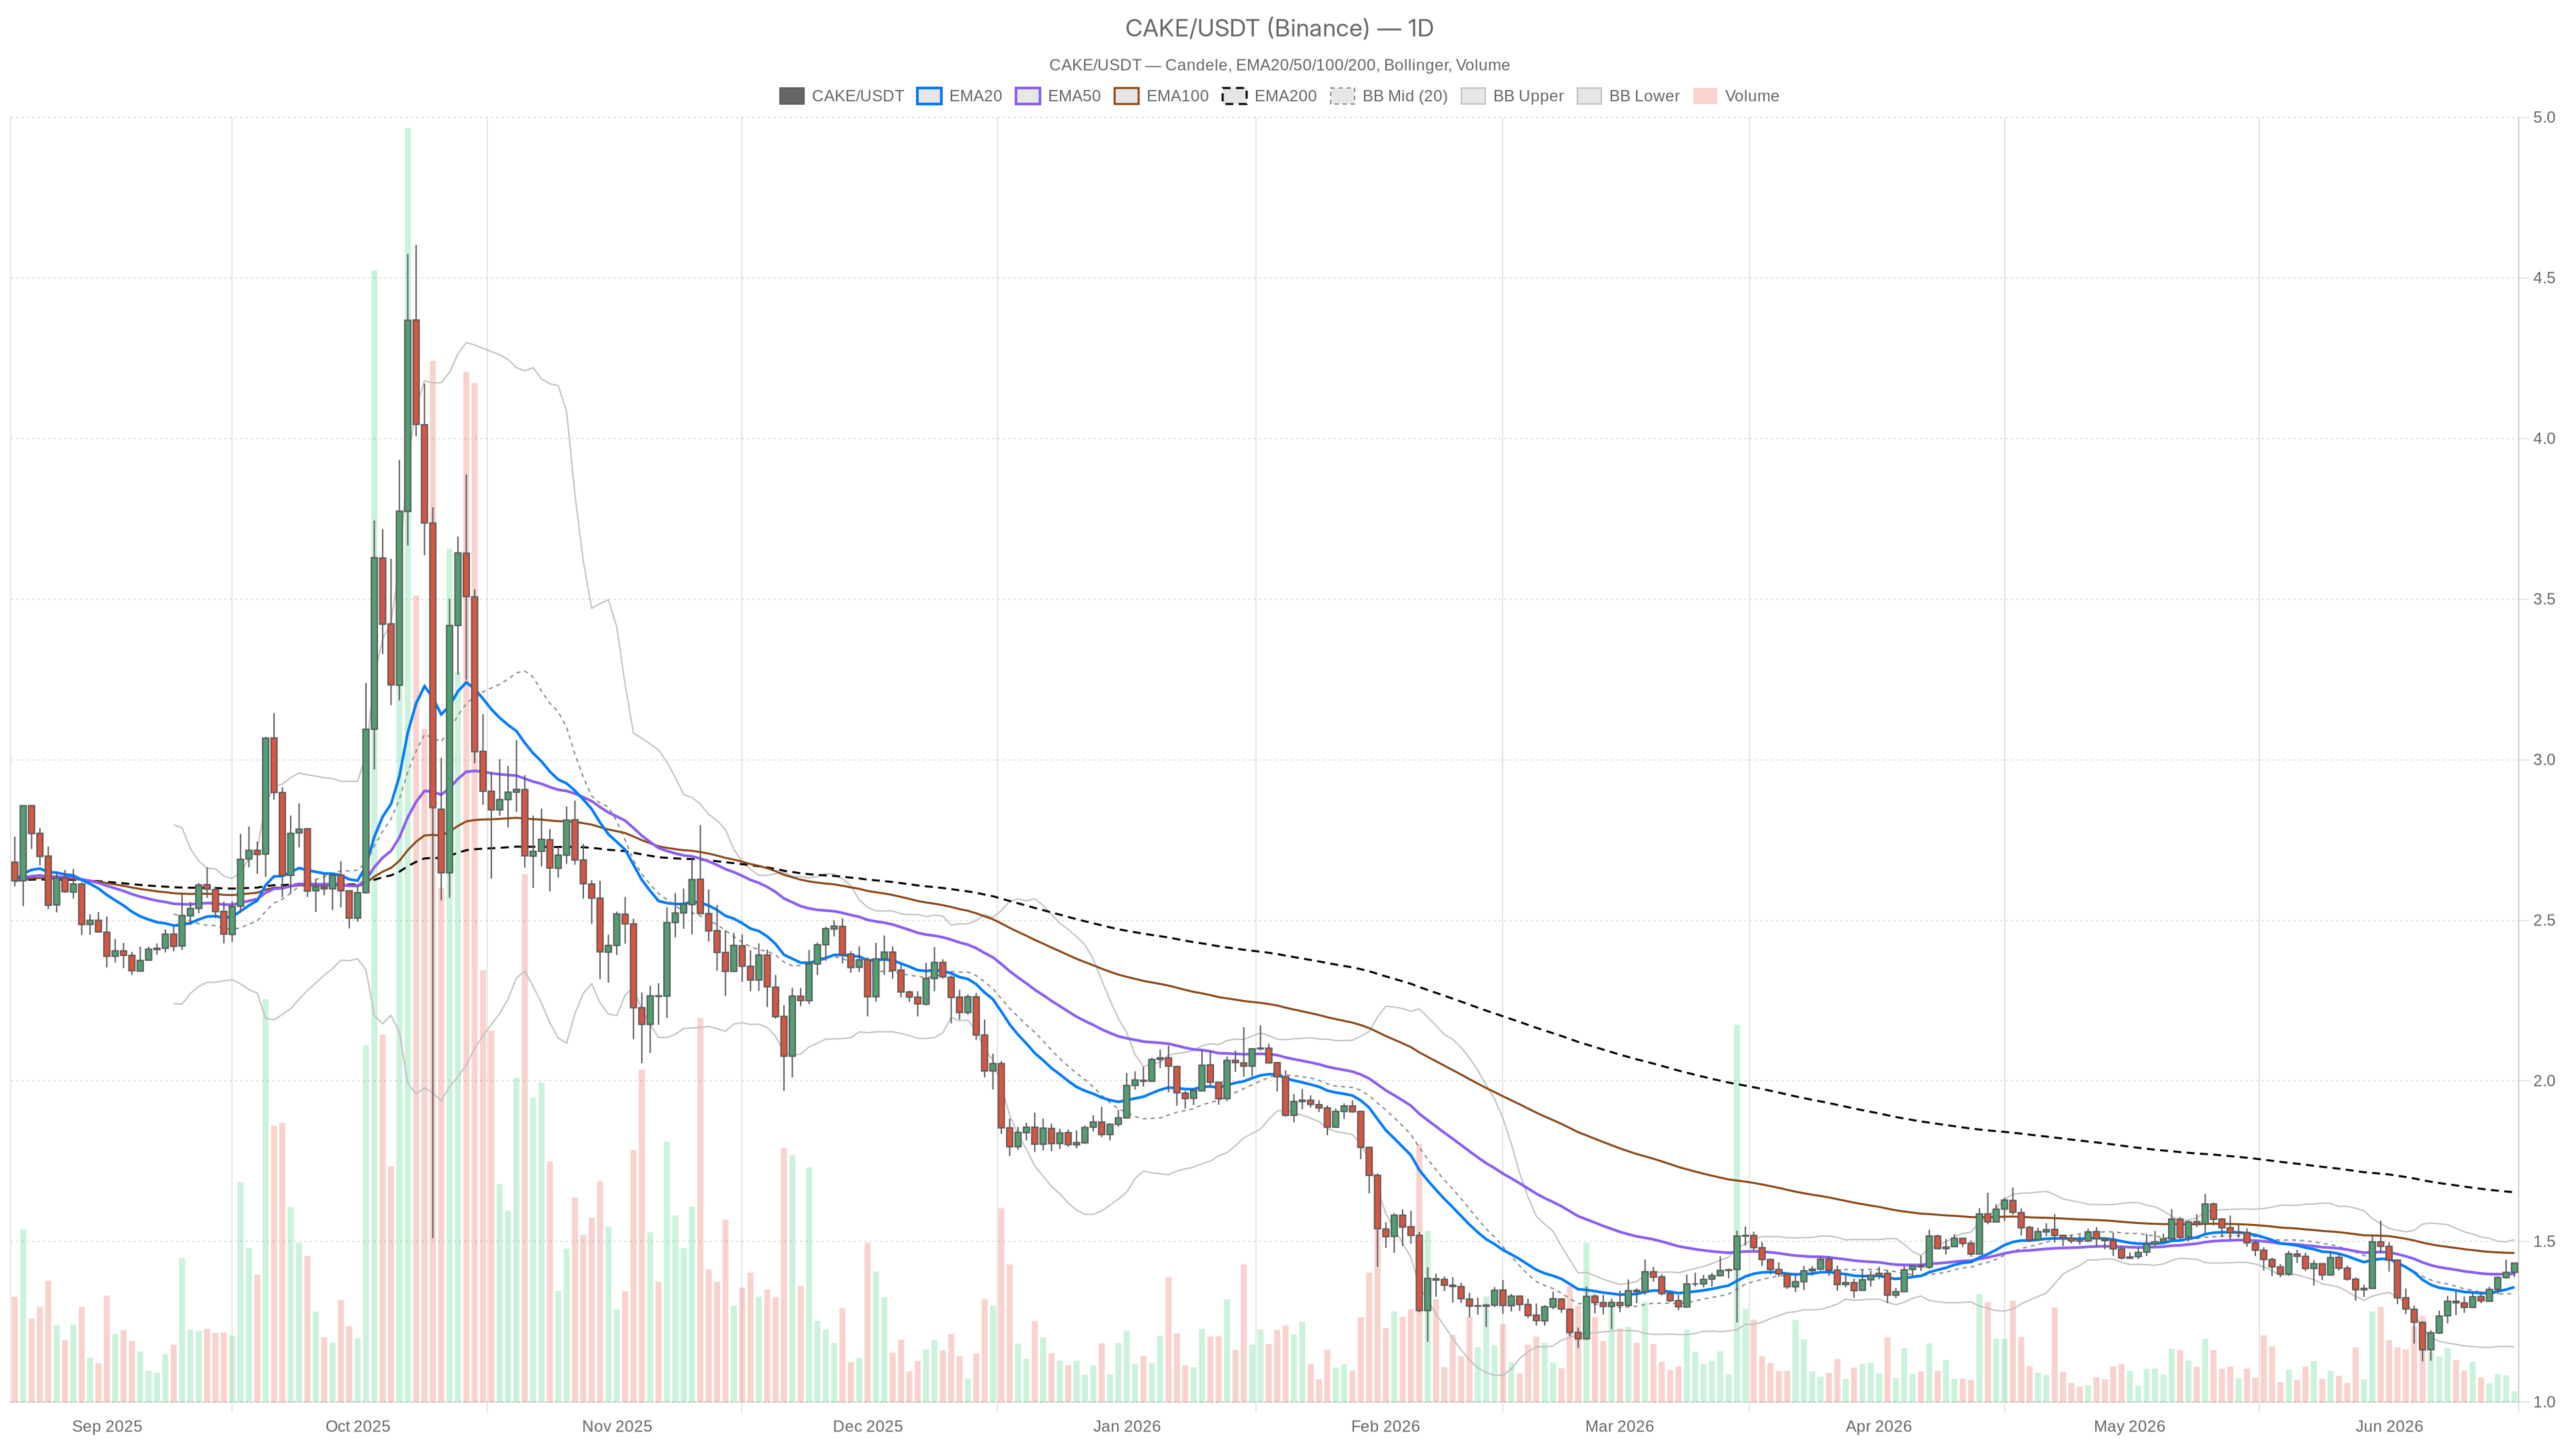
As of mid-June 2026, $CAKE trades at $1.43, placing the PancakeSwap price at a pivotal technical crossroads. Hourly momentum is constructive, yet the daily chart remains unconvinced. Extreme fear grips the broader market, making this a genuine battle between short-term strength and macro hesitation.
Key takeaways
- $CAKE trades at $1.43, above the 20-day and 50-day EMAs but still 15% below the 200-day EMA at $1.65.
- The Fear & Greed Index sits at 23 (Extreme Fear), with Bitcoin dominance above 56% suppressing altcoin momentum.
- Daily RSI at 56.91 shows marginal buyer control; hourly RSI at 65.29 signals room to run before overbought conditions.
- A daily close above $1.45 is needed to confirm the bullish case; failure to hold $1.40 tips the regime bearish.
Daily Chart: Recovering, But Not Convinced
On the D1, $CAKE closed at $1.43, placing it above both the 20-day EMA ($1.36) and the 50-day EMA ($1.40). Reclaiming short-term moving averages after a period of underperformance is typically the first step in structural repair. However, the 200-day EMA at $1.65 sits a full 15% above current price. That distance reveals where the PancakeSwap price actually stands in the bigger picture. The token is not in recovery mode; it remains in damage-control, still trying to build a base.
The daily RSI at 56.91 reinforces this read. It sits above the 50 midline, which is mildly positive — buyers have marginal control. Yet there is nothing close to the momentum you would expect from a token attempting a genuine trend reversal. The MACD on the daily remains technically in negative territory (line at -0.01, signal at -0.03), though the histogram has flipped to +0.02. That histogram tick is worth watching closely: it marks the first sign of slowing bearish pressure at the macro level. Not bullish confirmation, but a whisper of it.
Bollinger Bands on the daily place current price well above the midline ($1.34) and approaching the upper band at $1.51. This means $CAKE has already absorbed a good chunk of the room within its current volatility envelope. The daily ATR sits at $0.07, representing roughly a 5% daily swing range — moderate, not explosive. Pivot analysis shows the daily pivot point at $1.42, with R1 at $1.45 and S1 at $1.40. $CAKE trades just above its pivot, which is constructive, but R1 at $1.45 is a real near-term wall. A clean daily close above $1.45 would start to matter.
Hourly Structure: The Bullish Case Lives Here
The 1H chart is where the bullish argument actually has legs. Price sits above all three hourly EMAs — the 20 ($1.41), the 50 ($1.39), and the 200 ($1.34) — in a clean bullish stack. That kind of alignment across all three levels on the hourly is not trivial; it confirms the short-term trend is upward and the structure is ordered. Moreover, the hourly RSI at 65.29 is elevated but not yet in overbought territory. There is still room to run before sellers typically reassert themselves on this timeframe.
The hourly MACD is marginally positive (line and signal both at 0.01, histogram flat at zero). This does not scream momentum but does confirm the absence of selling pressure. Price is pressing against the upper Bollinger Band on the hourly ($1.43 upper, $1.41 mid), meaning it is stretched relative to its recent range. That squeeze is worth noting: when price rides the upper band, it can either keep walking it higher in a strong trend or snap back to the midline. Given the flat MACD histogram, there is no urgency in either direction right now.
The hourly pivot structure has R1 at $1.44 and S1 at $1.42. That $1.42–$1.44 zone is the zone that matters for any intraday positioning. A hold above $1.42 keeps the short-term bid intact. Conversely, a failure sends price testing $1.39 — the 50-hour EMA — which would start to erode the bullish case.
The 15-Minute Context
The 15-minute chart is pinned to the upper Bollinger Band with an RSI sitting at exactly 70 — technically the overbought threshold. The MACD is flat across all three lines (line, signal, histogram all at zero), suggesting the immediate move has run its course for now. This serves as an execution signal more than anything else: the short-term momentum burst is mature, and chasing here carries elevated risk of a pullback to the $1.41–$1.42 zone before any continuation. Entries on a pullback to that range, with the hourly structure still intact, would make far more structural sense than buying into this current 15-minute stretch.
The DEX Landscape and $CAKE’s Relevance
$CAKE operates in a challenging DEX landscape where it faces significant competitive pressure. DefiLlama data shows Uniswap V3 and V4 dominating fee generation, with Fluid DEX posting an eye-catching 228% 30-day fee growth. PancakeSwap is not listed among the top DEX fee generators in this current snapshot, which speaks to the competitive pressure the protocol faces. This does not directly move the price of $CAKE on any given day. However, it represents a structural headwind for token value accrual over time and helps explain why the daily chart has not built more convincing bullish momentum. Fundamentals and technicals are speaking the same language here: cautiously constructive at best.
Bullish and Bearish Scenarios
The bullish case requires a daily close above $1.45 (R1) on meaningful volume, confirming that buyers are absorbing supply rather than just drifting upward in a low-liquidity environment. From there, the next target zone is the upper daily Bollinger Band at $1.51. Beyond that lies the psychological $1.60 level before the 200-day EMA becomes the dominant conversation. This scenario is invalidated if price fails to hold $1.40 on a daily closing basis. That level coincides with the 50-day EMA and the daily S1; losing it would signal that the recent recovery was nothing more than a relief bounce.
The bearish scenario does not need a dramatic catalyst. If the broader market remains in Extreme Fear and Bitcoin dominance continues to suppress altcoin flows, $CAKE simply drifts lower. A break below $1.40 on the daily confirms the neutral regime is tipping bearish. The next meaningful support does not appear until the lower daily Bollinger Band at $1.17 — an 18% drop from current levels and a perfectly plausible outcome if macro sentiment deteriorates. The bearish case is invalidated only by sustained buying that pushes price through the $1.45–$1.51 resistance cluster with volume to match.
Positioning and Risk
$CAKE right now is a trader’s asset, not an investor’s one. The daily regime is neutral, the macro backdrop is fearful, and the nearest resistance is close enough to cap near-term upside quickly. Anyone already long from lower levels has a reasonable case to take partial profits near $1.45–$1.51, where the daily upper Bollinger Band and pivot resistance converge. For those seeking new positions, waiting for either a confirmed daily close above $1.45 or a clean pullback to $1.40–$1.41 — with hourly support intact — would define a far better risk-reward entry than buying into a 15-minute RSI at 70.
Volatility, as measured by the daily ATR, is moderate. Swings of $0.07 mean this is not a calm consolidation zone, and positions can move against you quickly. The conflict between a bullish hourly structure and a neutral daily regime is real and should not be dismissed. When timeframes disagree, the higher one wins eventually. Respect the daily until it gives you a reason not to.
FAQ
What is the short-term outlook for $CAKE?
The hourly chart displays a bullish structure with price above all three EMAs and an RSI of 65.29 that still has room to run. However, the daily chart remains neutral, and the 200-day EMA at $1.65 stands 15% above current price. A daily close above $1.45 would significantly strengthen the bullish argument.
What are the key support and resistance levels for $CAKE?
Immediate resistance sits at $1.45 (daily R1), followed by the upper daily Bollinger Band at $1.51 and the psychological $1.60 level. Key support rests at $1.40 (50-day EMA and daily S1), with the lower daily Bollinger Band at $1.17 serving as the next major floor if the current level fails.
Is now a favorable moment to enter a $CAKE position?
The current setup rewards patience. With the 15-minute RSI at 70 and price stretched against the upper Bollinger Band, chasing at $1.43 carries elevated short-term risk. A pullback to the $1.40–$1.41 zone with hourly support intact — or a confirmed daily close above $1.45 — would offer structurally superior entries.
Disclaimer: This article is for informational purposes only and does not constitute financial advice, an investment recommendation, or a solicitation to buy or sell any financial instrument or cryptocurrency. The analysis provided is not indicative of future results. Investing in crypto assets and financial markets carries a high risk of capital loss. Always do your own research (DYOR) and consult a qualified financial advisor before making any decision.
Article produced with the assistance of artificial intelligence and reviewed by the editorial team.