

 2
2
As of mid-June 2026, Avalanche trades near $6.93, and the broader Avalanche price crypto picture remains constrained by daily bearish pressure even as short-term charts hint at a fragile recovery.
Key takeaways
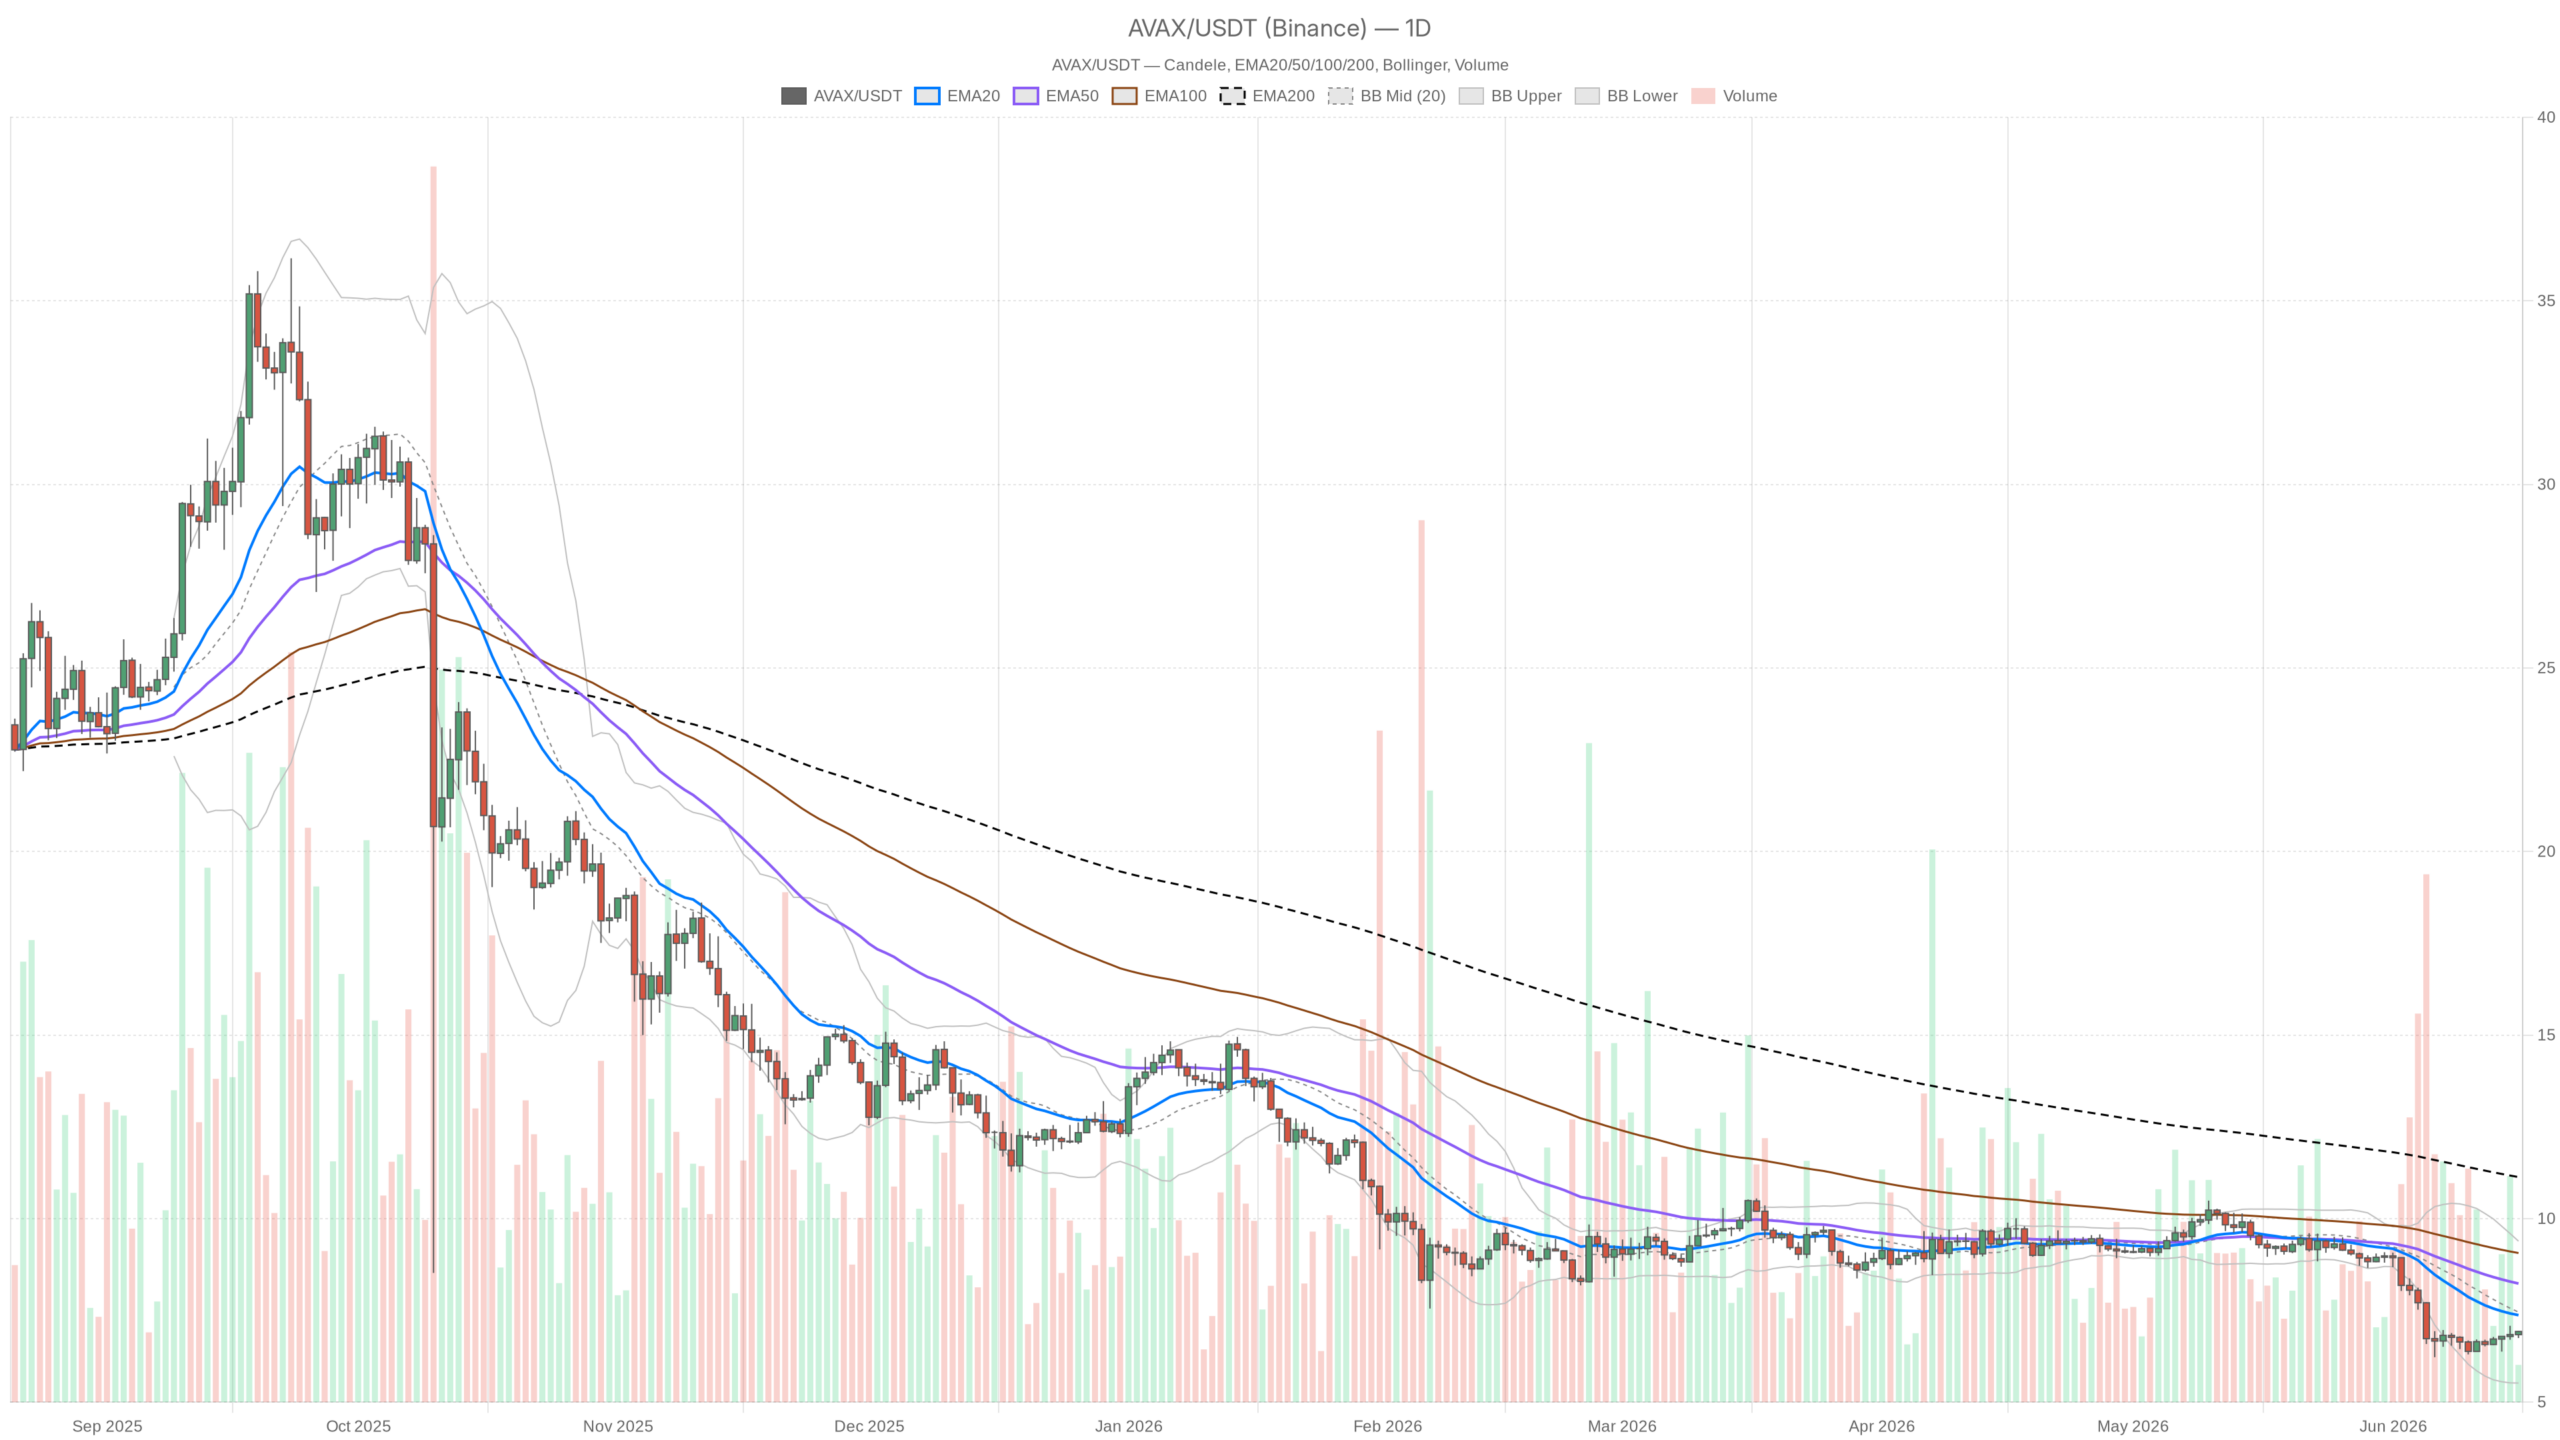
- $AVAX trades at $6.93, sitting well below the 20 EMA at $7.37, the 50 EMA at $8.23, and the 200 EMA at $11.13 on the daily chart.
- Daily RSI at 34.23 confirms persistent bearish momentum, while the hourly RSI at 58.71 reflects a short-term bounce still lacking conviction.
- Bitcoin dominance near 56.5% and the Fear & Greed Index at 23 create a risk-off environment that works against altcoin recoveries.
- The $6.80–$6.87 zone serves as the pivotal battleground: lose it and the bearish scenario accelerates toward $5.52.
- On-chain DEX data shows sporadic fee spikes rather than broad ecosystem growth, mirroring the asset’s uncertain price action.
The Daily Chart: Bearish Structure Dominates
The daily chart confirms a sustained downtrend with $AVAX trading below every major moving average. The cryptocurrency closed at $6.92, sitting well below the 20 EMA at $7.37, the 50 EMA at $8.23, and the 200 EMA at $11.13. When price trades beneath all three in a stacked-bearish configuration, the market is signaling a structural decline rather than a temporary dip. The distance from the 200 EMA — over 60% away — reflects how far $AVAX has fallen from equilibrium.
The daily RSI hovers at 34.23, near oversold territory but not quite there. However, in a sustained downtrend, being close to oversold rarely translates into an immediate buying opportunity. Markets can grind along the low-30s for weeks before any meaningful bounce materializes, especially when momentum has not flipped. The MACD remains negative at -0.61 against a -0.64 signal line. The histogram, however, prints a tiny positive 0.02 — a hairline divergence worth monitoring.
Bollinger Bands frame the situation clearly: the mid-band sits at $7.45, functioning as resistance, while the upper band rests at $9.38 and the lower band at $5.52. Price is compressing in the lower half of the range. Moreover, the ATR of $0.44 signals elevated volatility relative to price, meaning any directional move can cover meaningful ground quickly. Daily pivot analysis places the pivot at $6.87, with R1 at $6.99 and S1 at $6.80 — a tight crossroads with little technical conviction on either side.
Short-Term Timeframes: A Recovery Without Conviction
Short-term charts display a modest bounce, but the recovery lacks the conviction needed to challenge the daily downtrend. In fact, on the 1-hour chart, $AVAX trades at $6.93, above all three key EMAs — the 20 at $6.86, the 50 at $6.80, and the 200 at $6.80. This short-term alignment looks constructive. The hourly RSI at 58.71 reflects momentum that is positive without being overbought. The MACD is essentially flat, with both line and signal at 0.02 and a histogram of zero, confirming the move has been steady rather than explosive.
Hourly Bollinger Bands show price pressing toward the upper band at $7.06, with midline support at $6.89. The hourly regime is technically bullish. That said, the 15-minute chart tells a different story. The RSI sits at 70.6 — firmly overbought — and the MACD histogram is positive at 0.02. Price is pinned right at the upper Bollinger Band of $6.93, a classic short-term exhaustion setup where chasing longs carries elevated risk.
The tension between timeframes is significant. The daily structure favors bears. The hourly shows buyers reclaiming short-term ground. The 15-minute warns the micro move is overextended. Consequently, premature longs risk getting trapped, while impatient shorts face being squeezed. Neither camp holds a clean edge in this environment.
On-Chain Activity: Mixed Ecosystem Signals
Avalanche’s on-chain data reveals sporadic bursts of activity rather than broad-based ecosystem growth, mirroring the asset’s choppy price action. Meanwhile, data from DefiLlama shows uneven performance across the DEX landscape, underscoring the uncertain Avalanche price crypto environment. Blackhole CLMM posted a 41.5% spike in daily fees, and Pharaoh V3 surged nearly 74% in a single day. Both suggest a short-term burst of trading volume on the network. However, Joe V2.2 saw a 42.6% drop in fees over seven days. Pharaoh CL collapsed 98.2% in daily fees — a stark divergence that points to selective, rather than systemic, demand.
Uniswap V3 on Avalanche stands out as a notable exception, with 30-day fees up 277%, hinting at capital rotating into specific liquidity pools. Taken together, this data does not indicate broad ecosystem health. Instead, it reflects sporadic activity that correlates more with short-term speculation than with sustained demand for the underlying asset.
Bullish Scenario: What Bulls Need to See
A credible recovery requires $AVAX to reclaim the 20 EMA on a daily close, supported by improving broader market conditions. The first requirement is a clean daily close above $7.37 — the 20 EMA and the most immediate structural ceiling. A sustained push through that level would begin neutralizing the bearish EMA alignment and open the door toward the Bollinger mid-band at $7.45. From there, the $8.00 level becomes a psychological target. If the daily RSI climbs back above 40 while price holds above $7.37, bulls have a foundation to build on.
This scenario gains considerably more weight if broader sentiment improves — specifically, if Bitcoin dominance begins to decline from 56.5% and fear readings recover from extreme territory. However, any daily close back below $6.80 — the S1 support and a key structural level — would invalidate the recovery thesis and confirm the bounce as noise within the broader downtrend.
Bearish Scenario: The Path of Least Resistance
The bearish case requires little effort — structural momentum already favors further downside, with $5.52 as the natural target. If $AVAX fails to hold above the daily pivot at $6.87 and slips back below $6.80, the lower Bollinger Band at $5.52 becomes the gravitational target. With the daily RSI still outside technically oversold territory and the MACD deep in negative range, there is no strong technical reason to expect a durable reversal. In an Extreme Fear environment — the index sits at just 23 — altcoin recoveries tend to be short-lived and sharp.
A failure to break above $7.00 on the hourly chart — the current resistance cluster — would serve as an early warning that the short-term bounce is already losing momentum. That said, a confirmed break above the 20 EMA on the daily with volume would fundamentally alter the bear case and force a reassessment.
Positioning: Why Patience Matters
In a market where daily structure is bearish but short-term charts show life, patience is the most underrated trade. $AVAX sits in a zone where the daily structure has clearly favored bears for weeks. The short-term bounce is real, but statistically likely to be limited given macro headwinds — Bitcoin dominance at 56.5% and Extreme Fear at 23 both work against altcoin momentum. Moreover, the 15-minute RSI at 70.6 reinforces the idea that anyone who entered longs recently is already carrying a stretched position.
Moreover, volatility remains elevated: an ATR of $0.44 on the daily means $AVAX can swing nearly 6% of its current price in a normal session. This is not a low-risk environment for aggressive positioning in either direction. The $6.80–$6.87 zone acts as the pivot battlefield — lose that, and the bear case accelerates; hold it and build above $7.00, and the recovery thesis gets its first real test. Until one scenario plays out clearly, $AVAX remains in no man’s land.
Historically, this combination — technically alive on the short-term charts but structurally broken on the daily — rewards patience over conviction.
FAQ
Is Avalanche in a bear market right now?
Yes. The daily chart shows $AVAX trading below all three major exponential moving averages — the 20 EMA at $7.37, the 50 EMA at $8.23, and the 200 EMA at $11.13. With the daily RSI at 34.23 and the MACD still negative, the structural trend remains bearish despite short-term bounces on lower timeframes.
What price level does $AVAX need to reclaim for a trend reversal?
A clean daily close above the 20 EMA at $7.37 is the first level bulls must reclaim. Sustained trading above that level, combined with the daily RSI climbing past 40, would begin neutralizing the bearish structure. A move above the Bollinger mid-band at $7.45 and then $8.00 would further strengthen the recovery case.
What is the worst-case downside target for $AVAX?
If $AVAX loses the $6.80 support level — which aligns with the S1 pivot — the lower Bollinger Band at $5.52 becomes the natural downside target. In the current Extreme Fear environment with Bitcoin dominance still elevated, a slide toward that level remains structurally plausible.
Disclaimer: This article is for informational purposes only and does not constitute financial advice, an investment recommendation, or a solicitation to buy or sell any financial instrument or cryptocurrency. The analysis provided is not indicative of future results. Investing in crypto assets and financial markets carries a high risk of capital loss. Always do your own research (DYOR) and consult a qualified financial advisor before making any decision.
Article produced with the assistance of artificial intelligence and reviewed by the editorial team.


