

 4
4
Solana is testing a major resistance cluster near $70-$72 after hitting its Elliott Wave target. If buyers hold the breakout from the falling wedge, analysts say $SOL could start building toward much higher levels.
Solana's latest rebound has reached a key technical objective, putting the next move under the spotlight. After recovering from June lows, $SOL is now testing a major Fibonacci resistance cluster that could determine whether the rally continues or loses steam.
According to More Crypto Online, the $SOL/USD 4-hour chart shows Solana reaching its projected 100% Elliott Wave extension target near $70.78. The rally has pushed price into a dense resistance zone formed by multiple Fibonacci levels, where buyers and sellers are likely to battle for control.
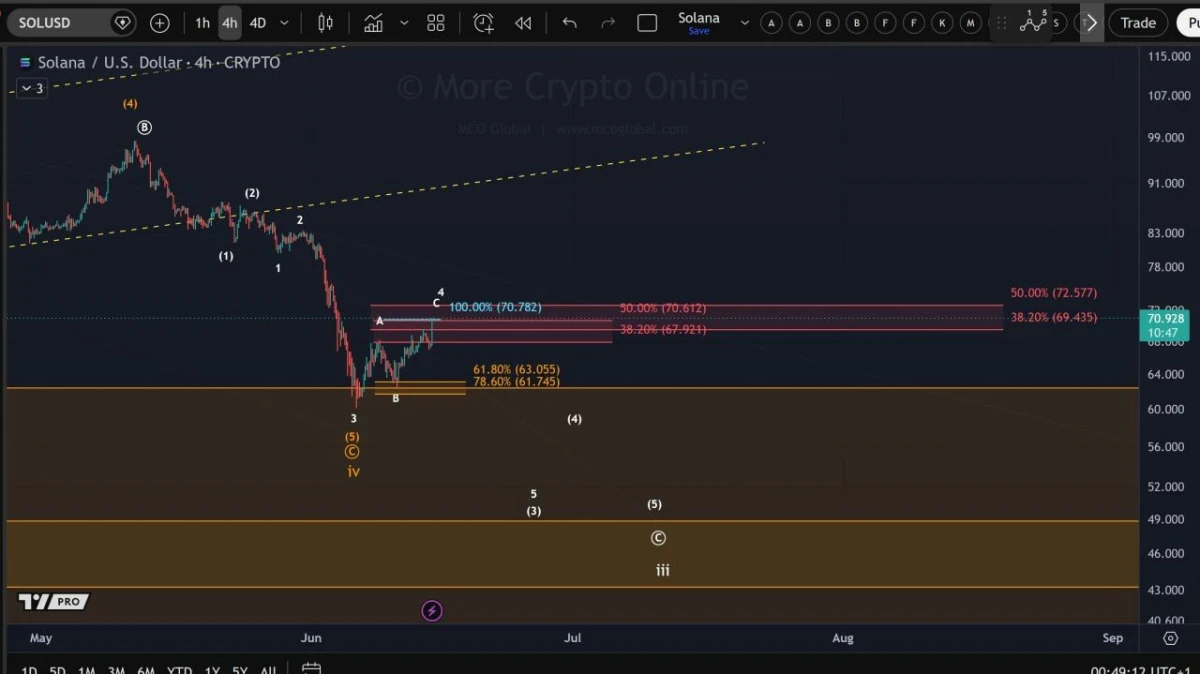
$SOL/USD 4-Hour Chart. Source: More Crypto Online (@Morecryptoonl) via TradingView
The chart highlights immediate resistance between $69.44 and $72.58, including the 38.2% retracement at $69.44, the 100% extension at $70.78, and the 50% retracement near $72.58. The convergence of these levels suggests the current area could act as a major decision point for the market.
According to the analysis, a decisive breakout above this resistance cluster would strengthen the bullish case and indicate that Solana's recovery has room to extend further. However, failure to clear the zone could signal that the corrective rally is complete and increase the risk of another move lower.
On the downside, support remains near $63.06-$61.75. Holding above that area would preserve the short-term bullish structure, while a break below it could shift momentum back in favor of sellers.
For now, traders are watching whether Solana can convert its Elliott Wave target into a breakout catalyst or whether this key resistance zone marks the end of the recent advance.
Solana may be entering a new phase after breaking out of a long-term falling wedge pattern that has constrained price action for months. The move has reignited bullish speculation, with some traders now setting their sights on significantly higher levels.
According to Satoshi Flipper, the $SOL/$USDT daily chart shows Solana rebounding from the lower boundary of a broad descending wedge before breaking above the upper trendline near the $70 area. The analyst believes the breakout could mark the beginning of a larger trend reversal, with a long-term target near $250.
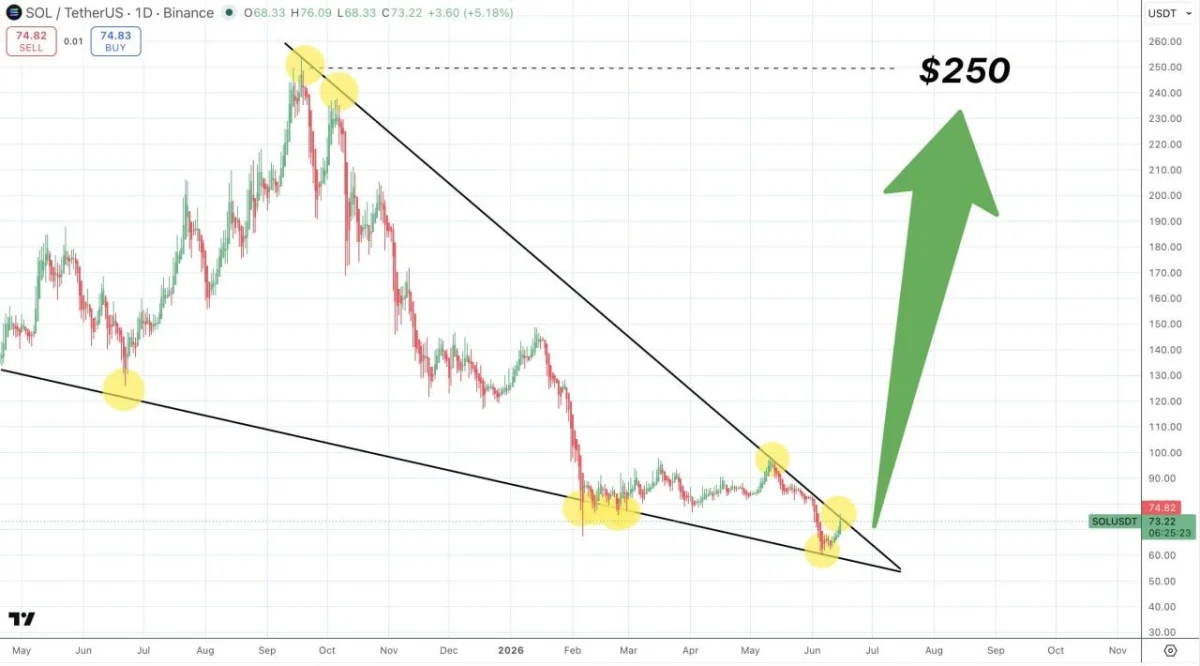
$SOL/$USDT Daily Chart. Source: Satoshi Flipper (@SatoshiFlipper) via TradingView
The chart highlights multiple historical reactions along both trendlines, reinforcing the validity of the wedge structure. After finding support near $60, $SOL reclaimed the upper boundary and pushed toward the mid-$70s, signaling improving momentum.
According to the analysis, maintaining the breakout above the former resistance trendline would strengthen the bullish case and support the possibility of a move toward previous cycle highs. A rally toward $250 would represent a return to levels last seen during Solana's strongest periods of market expansion.
However, the projected target remains speculative. Falling wedge breakouts do not always achieve their full measured moves, and Solana will still need to overcome several intermediate resistance levels before a larger advance can develop.
For now, traders are watching whether Solana can hold above the breakout zone and build momentum, or whether the move proves to be another temporary recovery within a broader consolidation phase.