


 7
7
Solana is fighting to reclaim key support after bouncing from its major $60 demand zone. With the FOMC meeting approaching and resistance near $70, the next move could determine whether $SOL's recovery gains momentum or loses steam.
Solana Tests Key Weekly Level as Traders Watch for Structure Shift
Solana is attempting to reclaim a major weekly support level after bouncing from its last significant demand zone.
According to Daan Crypto Trades, $SOL/$USDT is trying to move back above the $67 area, a level that previously marked the February low. After dropping into the $60 support zone, Solana has staged a rebound, putting its short-term market structure at an important crossroads.
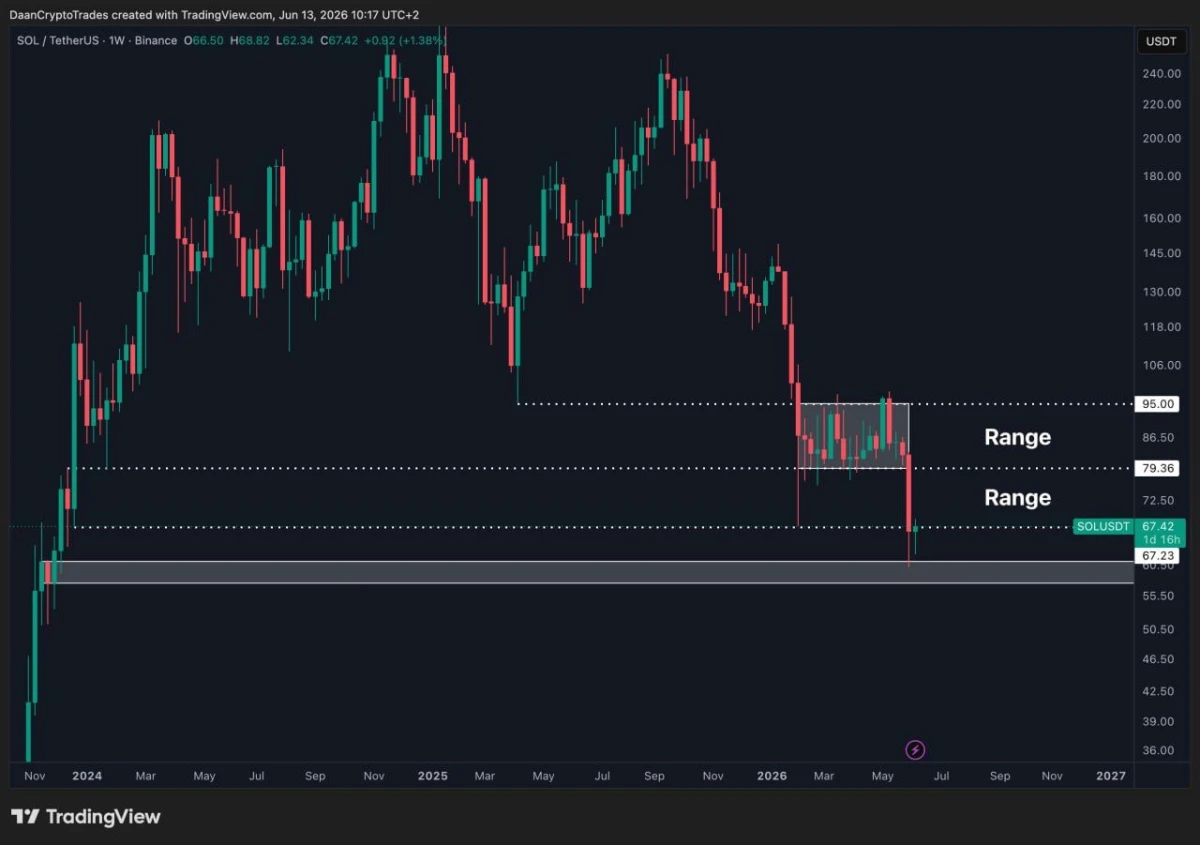
$SOL/$USDT Weekly Chart. Source: Daan Crypto Trades (@DaanCrypto) via TradingView
The chart highlights $60 as Solana's final major weekly support area, where buyers stepped in to halt the decline. Meanwhile, the $67 level has emerged as the immediate battleground, acting as a key horizontal level that could determine the next directional move.
According to the analysis, reclaiming and holding above $67 would be an early sign that Solana is beginning to shift its local market structure back in favor of the bulls. Such a move could open the door for a retest of higher weekly resistance levels around $79 and $95.
However, the recovery remains unconfirmed. If $SOL fails to maintain momentum above $67, the rebound could lose strength and increase the risk of another test of the $60 support zone.
For now, traders are closely watching whether Solana can flip the $67 level into support and build a stronger recovery, or whether sellers will regain control of the weekly trend.
Solana Nears $70 Target as FOMC Risk Looms
Solana is approaching a short-term resistance area near $70 after rebounding from recent lows.
According to Matthew Dixon, the $SOL/USD 4-hour chart shows price moving toward an overhead target around $70, a level that may align with the upcoming FOMC meeting. He suggested that a hawkish policy tone could pressure risk assets if markets start pricing in higher interest rates.
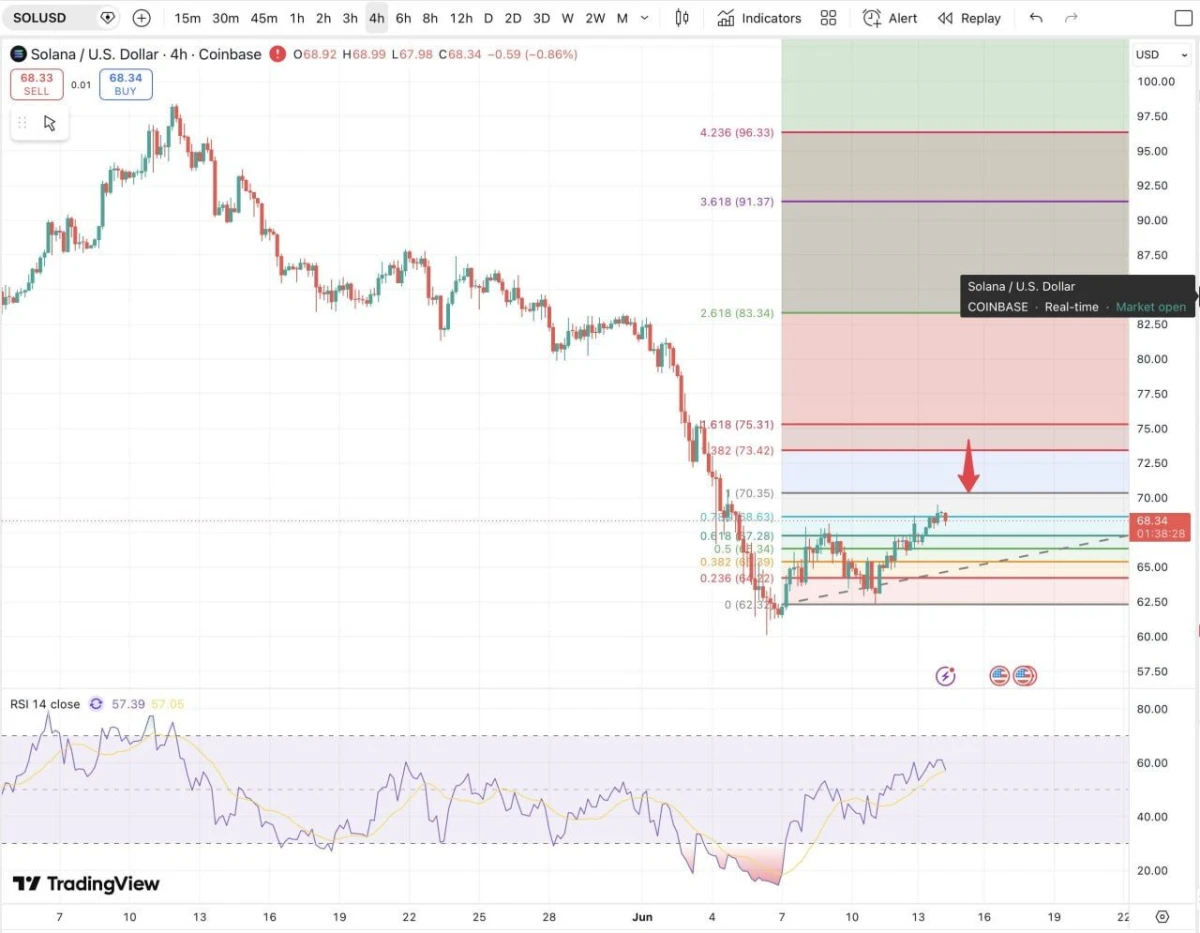
$SOL/USD 4-Hour Chart. Source: Matthew Dixon (@mdtrade) via TradingView
The chart shows $SOL recovering from the $60 area and moving through several Fibonacci levels. Price is now testing the $68-$70 zone, while RSI has also recovered from oversold conditions and is approaching stronger momentum territory.
However, the analyst still expects a broader low around October, tied to Bitcoin's halving cycle timing and a potential return of liquidity afterward. That means the current move may remain a short-term relief rally unless $SOL breaks higher and sustains momentum.
For now, traders are watching whether Solana can reach and clear the $70 area, or whether macro pressure around the FOMC meeting limits the rebound.

