


 2
2
$SIREN trades at $0.1396 on June 13, down 70.68% in a single session after on-chain analyst EmberCN flagged a whale selling 17 million tokens across multiple addresses in under two hours, pushing price from $0.47 to $0.23 before losses extended to a low of $0.1127.
$SIREN Daily Chart: Price Sits on the Lower Bollinger Band After a Vertical Drop
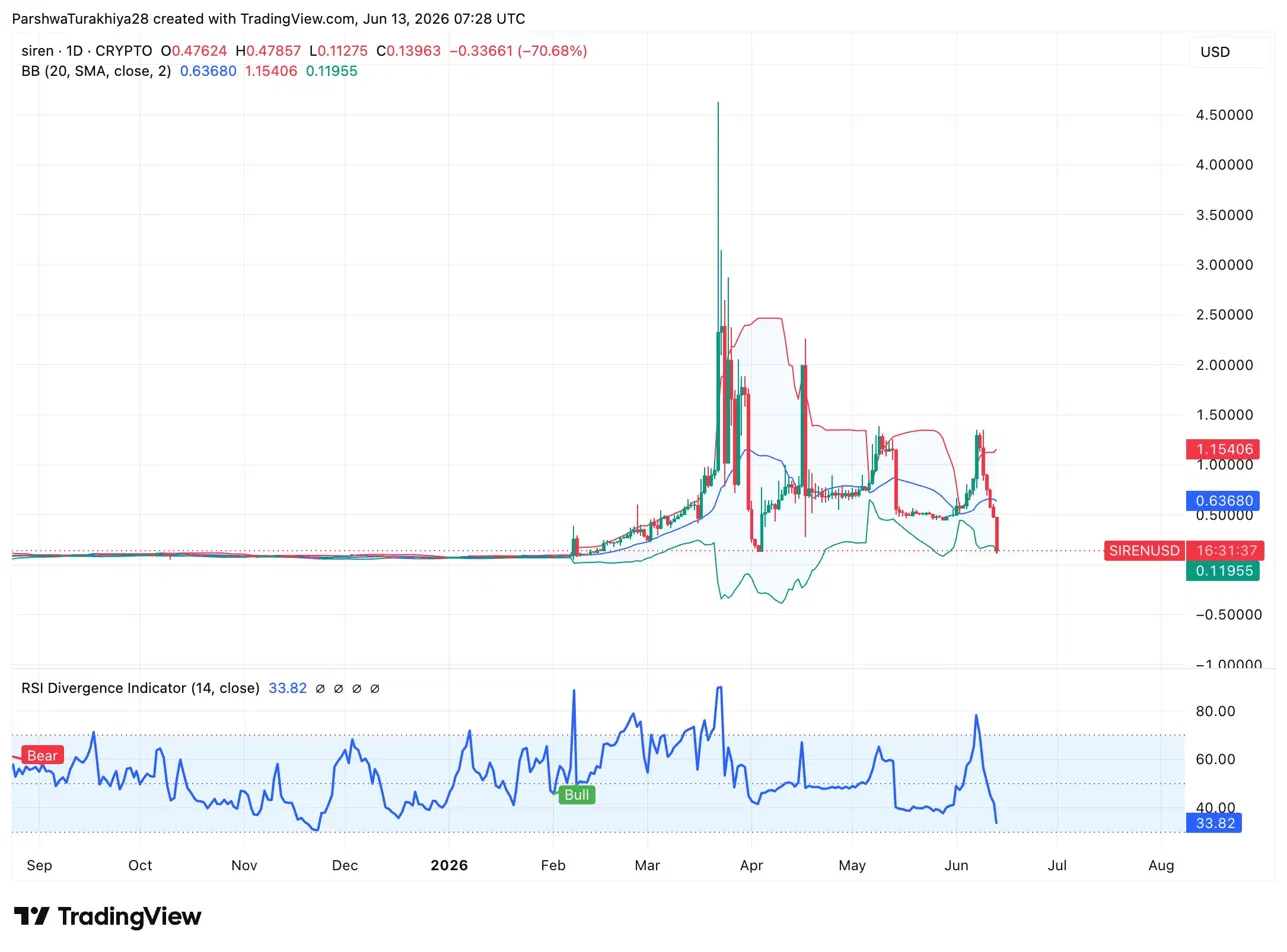
The daily chart tells the full story in one candle. $SIREN opened at $0.47624, hit a high of $0.47857, then collapsed to a low of $0.11275 before recovering slightly to $0.1396. The lower Bollinger Band sits at $0.11955, and price wicked below it before closing above. The Bollinger midline at $0.63680 and upper band at $1.15406 are irrelevant as resistance at this point.
RSI at 33.82 is approaching oversold but has not printed a bullish divergence yet. The prior bullish divergence in February 2026 came just before the first major pump cycle. Whether the same setup repeats depends entirely on what the controlling wallets decide to do next, not on technical structure.
- Resistance: $0.2300 (dump origin), $0.4700 (pre-crash level)
- Support: $0.1196 (lower Bollinger Band), $0.1127 (session low)
What Actually Happened: Four Rounds of the Same Playbook
[$SIREN 控盘者] 在过去 2 小时里密集通过多个地址在链上抛售了约 1700 万枚 siren-2:native (675 万),致使 $SIREN 暴跌了 50%+ ($0.47→$0.23)。
— 余烬 (@EmberCN) June 13, 2026
$SIREN 这个币,庄家是绝对控盘的,他们控制着至少 94% 总量 (6.8 亿枚) 的币。
所以这 K… https://t.co/fSrGTLsIS7 pic.twitter.com/gpyrdDX7jx
EmberCN’s on-chain data shows wallets linked to a single entity sold roughly 17 million $SIREN tokens including 6.75 million siren2-native tokens across multiple addresses within a two-hour window on June 13. The coordinated selling across multiple wallets dropped price from $0.47 to $0.23 before market depth gave out entirely.
The analyst describes this as the fourth identical cycle since February 2026. The pattern is consistent: accumulate, pump aggressively to flush shorts via liquidations, then dump into the long positions that opened during the rally, collect the chips and reset. Each cycle runs roughly four to six weeks before the next pump begins.
The concentration is the core issue. Wallets linked to this entity hold at least 94% of $SIREN’s 680 million token supply, meaning roughly 640 million tokens sit in controlled addresses. With that level of supply control, the price chart reflects deliberate decisions rather than market forces.
$SIREN Derivatives: Volume Explodes 274% While OI Collapses
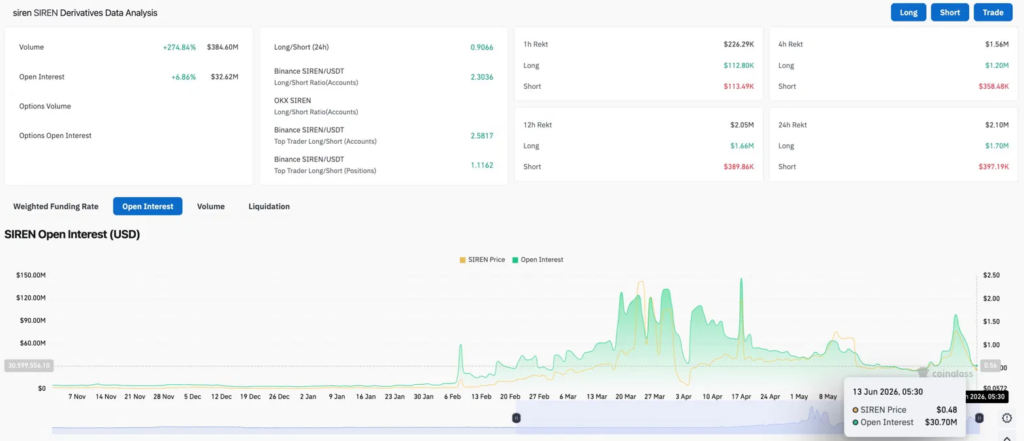
Volume surged 274.84% to $384.60M as the crash triggered a wave of forced closures. Open interest rose 6.86% to $32.62M in the aftermath, but that number needs context. On June 8, OI stood at $98.50M. The difference represents over $65M in positions that were liquidated or closed during the crash.
Over 24 hours, $1.70M in long positions were liquidated against $397.19K on the short side. Longs paid the heavier price, which fits the pattern EmberCN described: the whale first pumps to flush shorts, then dumps to flush the longs that replaced them.
The long/short ratio of 0.9066 now leans slightly bearish. Binance top traders hold a 2.5817 long bias in accounts but that is a position ratio, not a signal of smart money confidence.
$SIREN Price Prediction for June 15, 2026
- Upside: A hold above the lower Bollinger Band at $0.1196 and a reclaim of $0.2300 is possible if the controlling wallets begin accumulating again ahead of a fifth cycle. RSI nearing oversold creates the technical setup for a bounce.
- Downside: A daily close below $0.1127 removes the session low floor with no historical support beneath it. Given 94% supply concentration, the downside scenario is a function of whale intent rather than chart structure.
