


 7
7
Historical data from the Dogecoin Bubble Risk indicator shows that the meme coin’s price could be close to a bottom.
Dogecoin ($DOGE) has remained under pressure along with the broader crypto market. The meme coin has fallen by more than 14% this month and is down nearly 27% since the beginning of the year.
At the time of writing, $DOGE trades around $0.08, placing it well below the important $0.1 level. The recent decline follows the latest broader market sell-off that has affected most crypto assets.
Amid the downtrend, market analyst Joao Wedson believes Dogecoin may be getting close to the end of its current downtrend. In a recent analysis, he highlighted on-chain indicators that suggest the cryptocurrency could already be forming a price bottom.
Dogecoin Bubble Risk Indicator
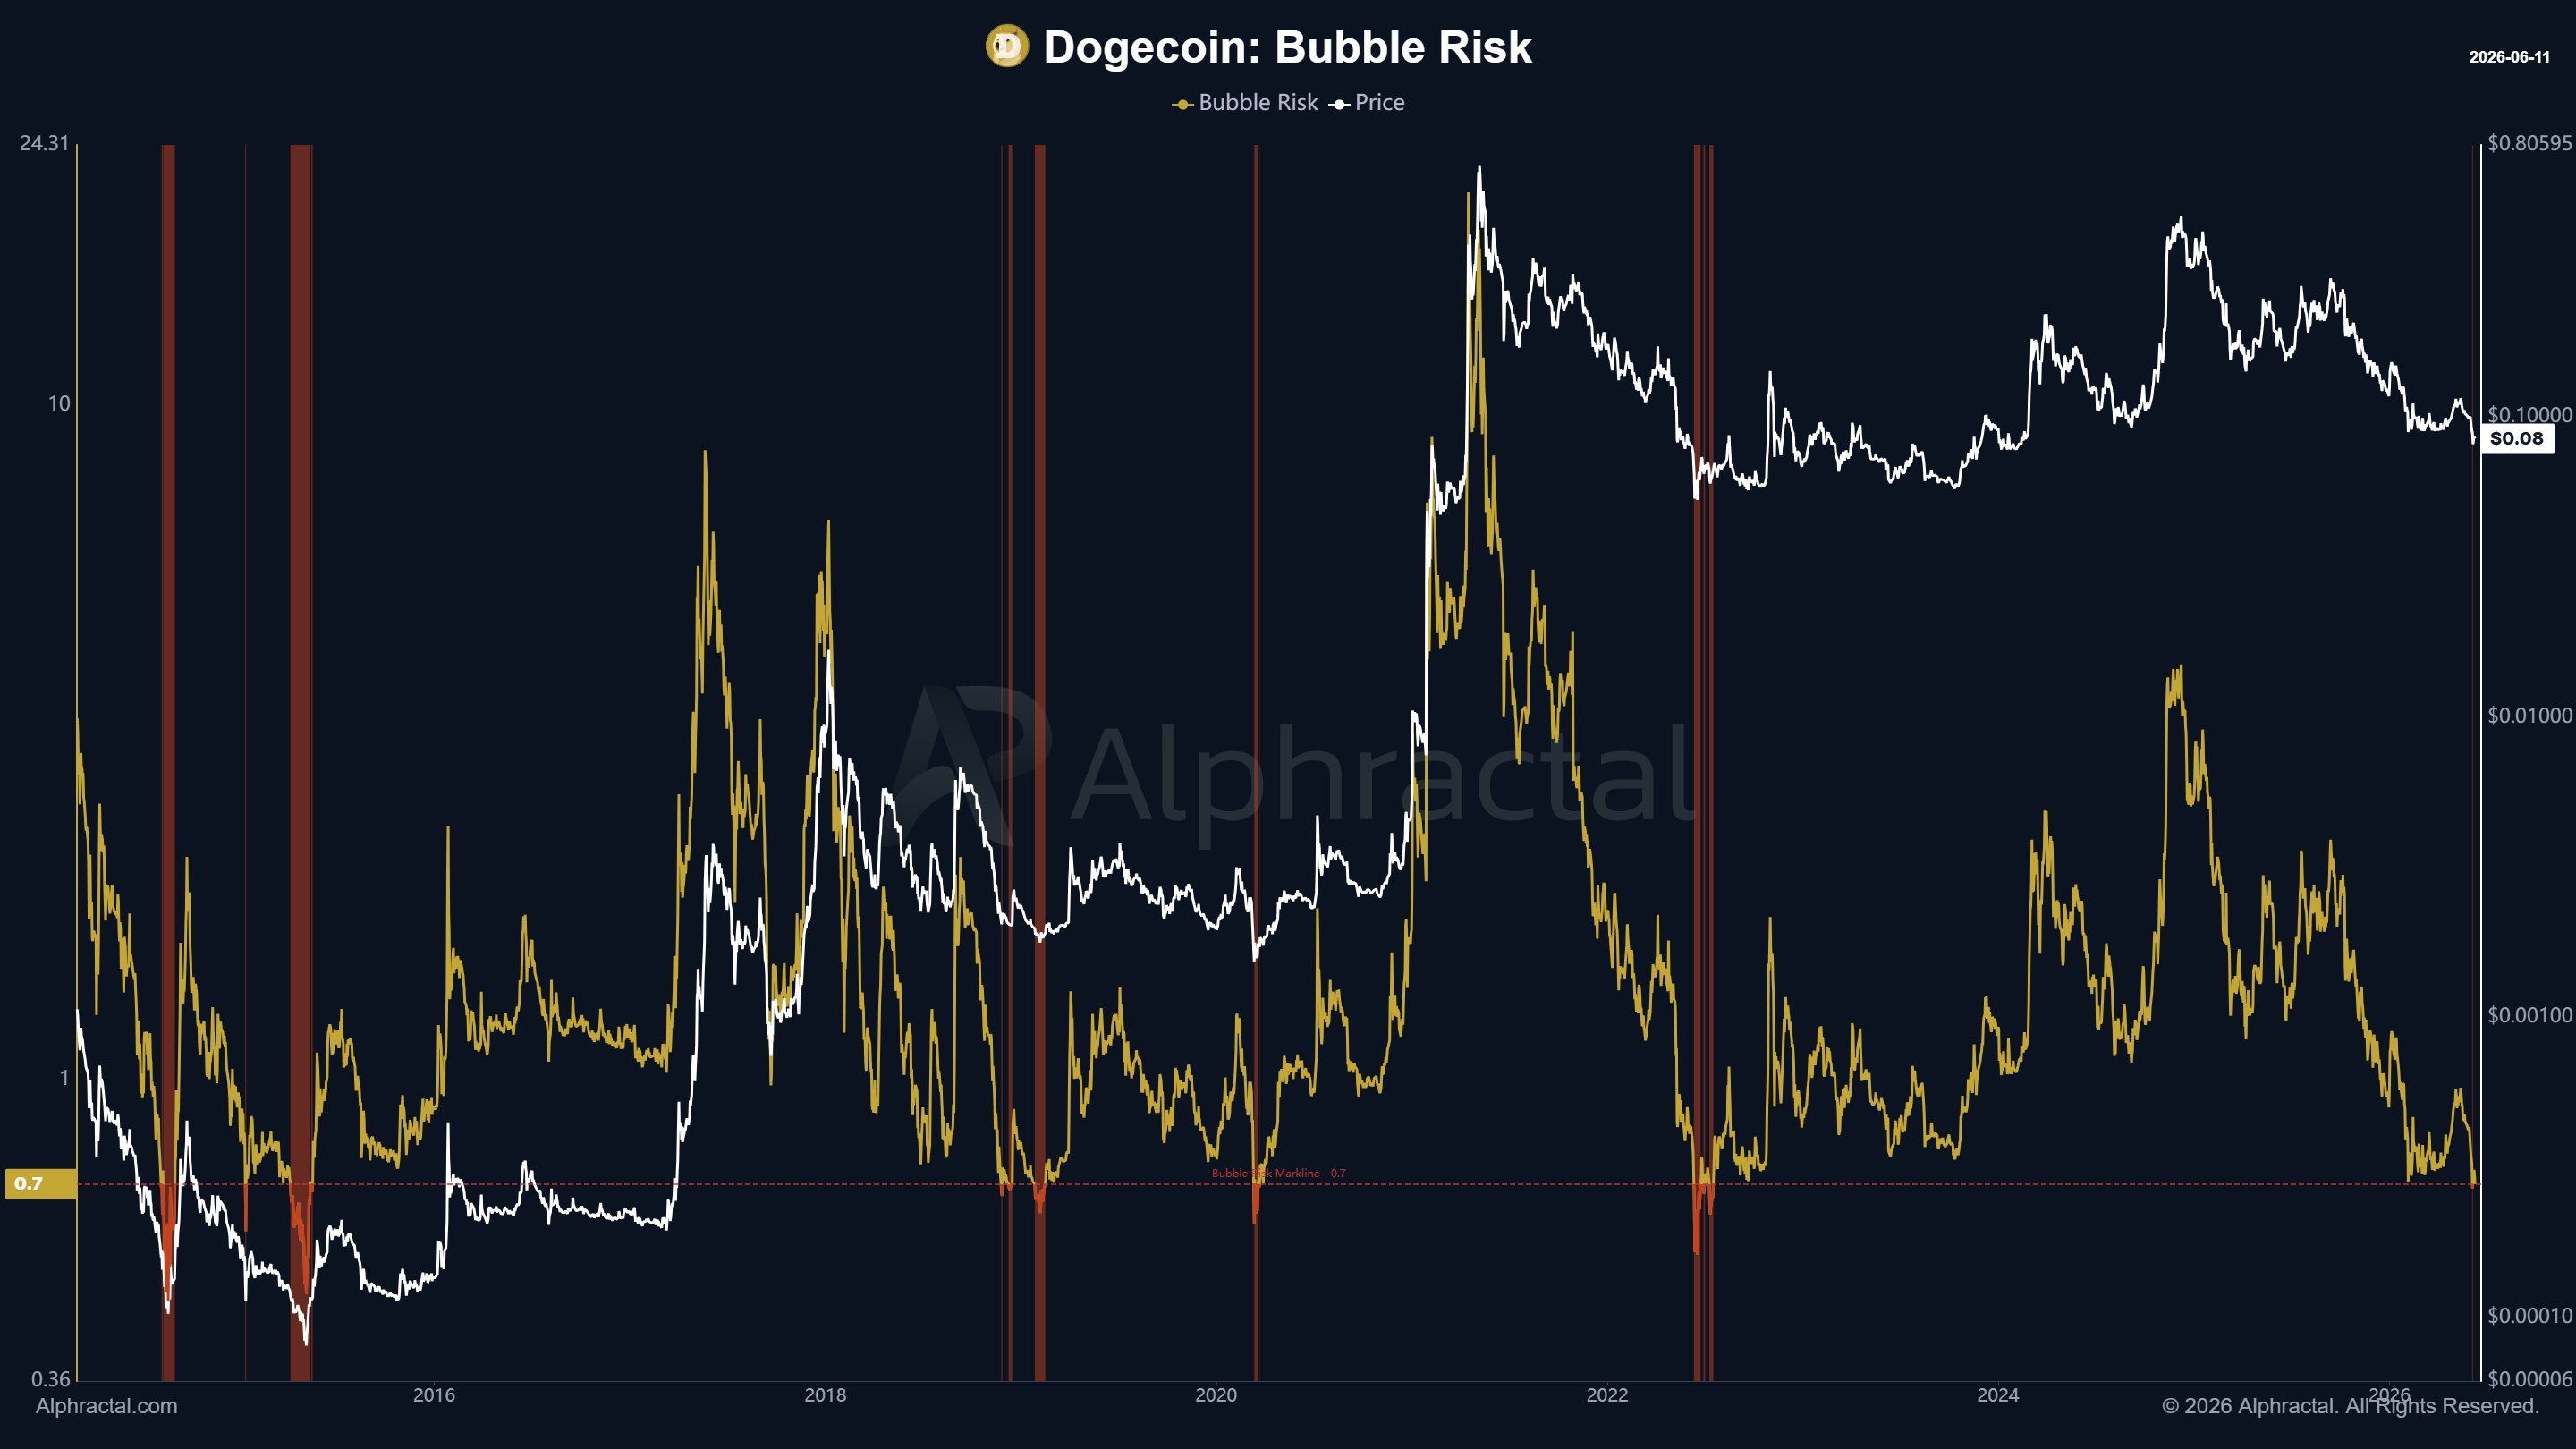
Wedson reiterated that buying Dogecoin below $0.08 could prove to be a strong strategy. To support his thesis, he highlighted the Bubble Risk indicator, a metric designed to measure the chances of a speculative bubble forming in the market.
The indicator combines three major valuation models into a single reading. Specifically, it gives a 30% weighting to the price-to-realized price ratio, another 30% to Alpha Price deviation, and 40% to the CVDD ratio.
The indicator seeks to identify periods when prices become overly stretched and vulnerable to sharp corrections by bringing these metrics together.
Notably, the model was built to detect unsustainable valuations that come from excessive market optimism. To improve the reliability of its readings, the calculation starts from the sixth record onward, which helps create a more stable data set.
Current Readings Match Previous Bottoming Zones
According to Wedson, the Bubble Risk indicator places emphasis on three of Dogecoin’s most important valuation models. He explained that the metric has now entered a region that has historically been linked to price bottoms. At present, the indicator sits slightly below the key 0.7 level while Dogecoin trades near $0.08.
The analyst also called attention to the Alpha component of the model, noting that investors should pay attention to it. He believes Dogecoin may already be approaching a bottoming phase based on the current readings.
Data from Wedson’s chart supports this. The Bubble Risk indicator has repeatedly identified major Dogecoin bottoms across several market cycles. Each time the metric dropped below the 0.7 threshold, Dogecoin eventually reached a major floor before beginning a recovery.
What Historical Data Says
The first instance on the chart came in May 2015 when Dogecoin fell to a low of $0.000086. During this period, the Bubble Risk indicator moved below 0.7, and this aligned with $DOGE’s bottom for that cycle.
The same positioning appeared again in March 2020, when $DOGE reached a bottom of $0.001344. Once again, the indicator fell below the 0.7 mark before the market turned higher.
A similar situation played out during the 2022 bear market. In June 2022, Dogecoin dropped to $0.0491, and the Bubble Risk metric once again moved below the same threshold. In all three cases, a recovery followed, although some rebounds took several months to gain momentum.
With the indicator currently sitting slightly below 0.7 and Dogecoin trading at $0.08, Wedson believes the asset may now be trading within an attractive accumulation zone.
Long-Term Dogecoin Reversal in View
Meanwhile, analyst Kamran Asghar also highlighted a potentially bullish setup for Dogecoin. According to his analysis, $DOGE is forming a large rounded-bottom pattern on the 1-week chart.
At the same time, the Relative Strength Index (RSI) continues to form higher lows, suggesting that momentum may be improving despite the recent weakness in price.
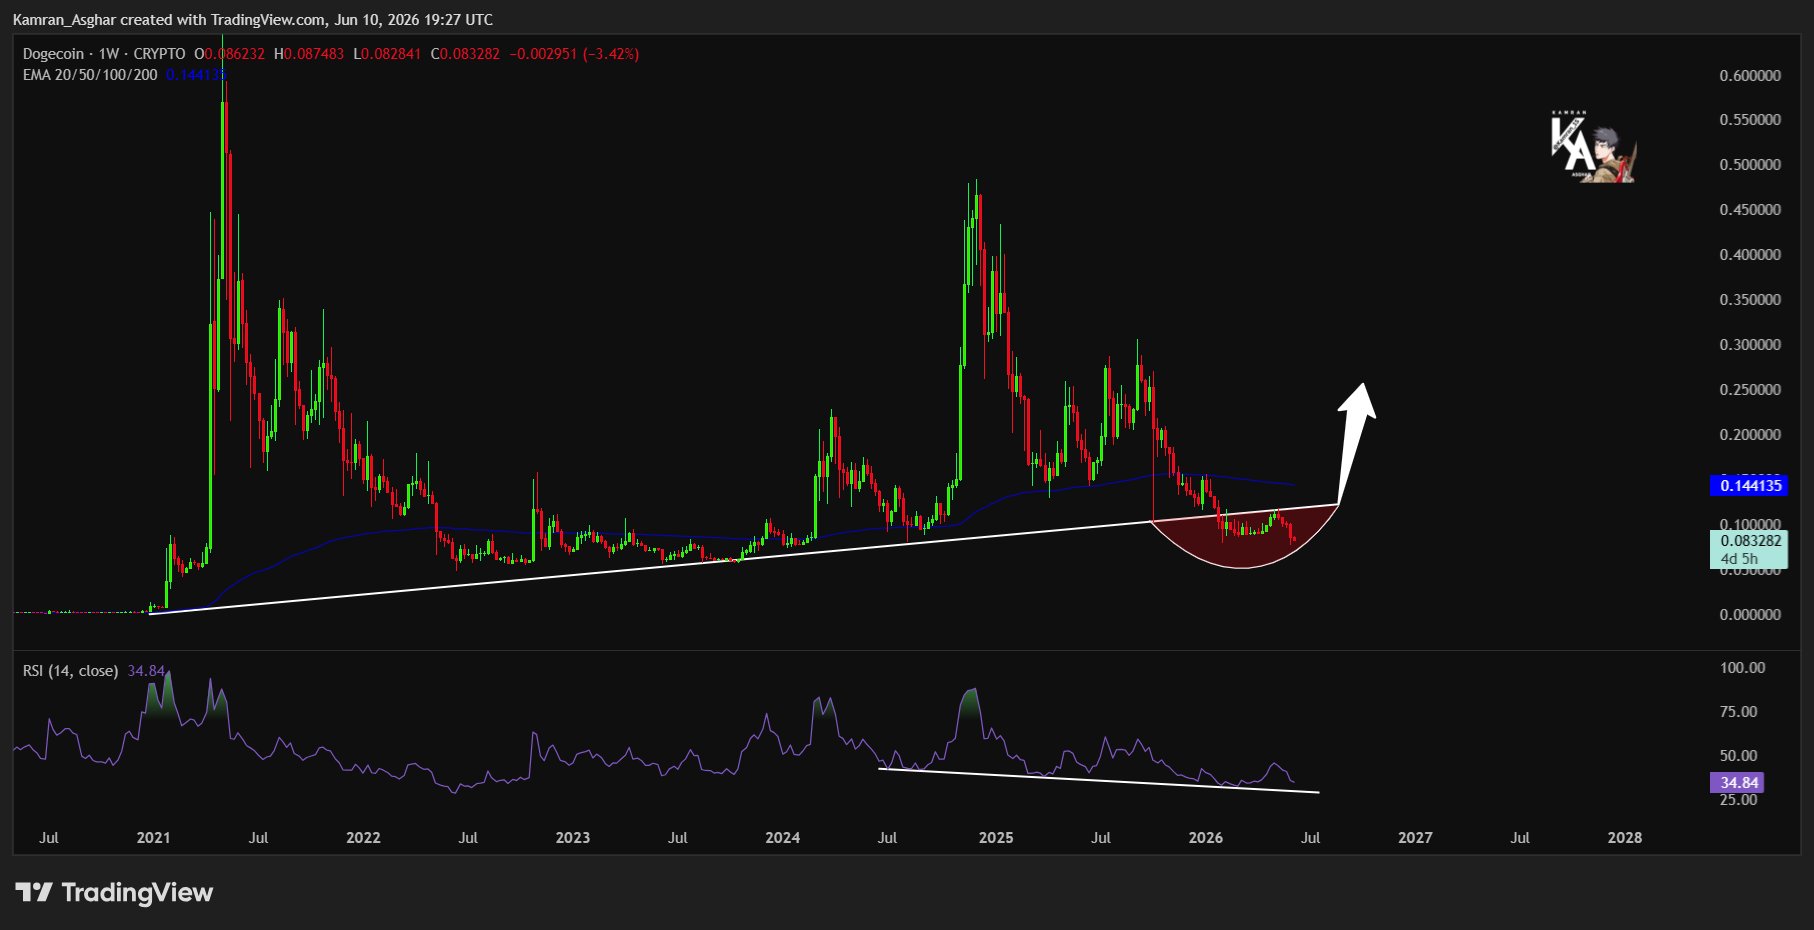
Asghar believes that if this chart pattern confirms, Dogecoin could be preparing for a major trend reversal after spending years in an accumulation phase. This supports the theory that the meme coin may be approaching an important long-term bottom.


