


 16
16
Notably, the broader meme coin sector has taken a beating, with Dogecoin, Shiba Inu, and Pepe all selling off alongside $BONK as the crypto market pulled back last week.
At its current price, $BONK coin sits just above the $0.0000040 swing low, a level that has now emerged as the line between a painful correction and a potentially deeper breakdown.
Whether this support holds or breaks will likely define $BONK's next major move.
The technicals are heavily stacked against $BONK coin
Across 23 tracked technical indicators, the majority are pointing lower.
The moving average breakdown is particularly stark, with the $BONK memecoin currently trading below five key daily exponential moving averages (EMAs): the 10, 20, 50, 100, and 200-day EMAs.
Every single one of those averages is sitting above the current price, acting as a layer of overhead resistance that any recovery would need to push through.
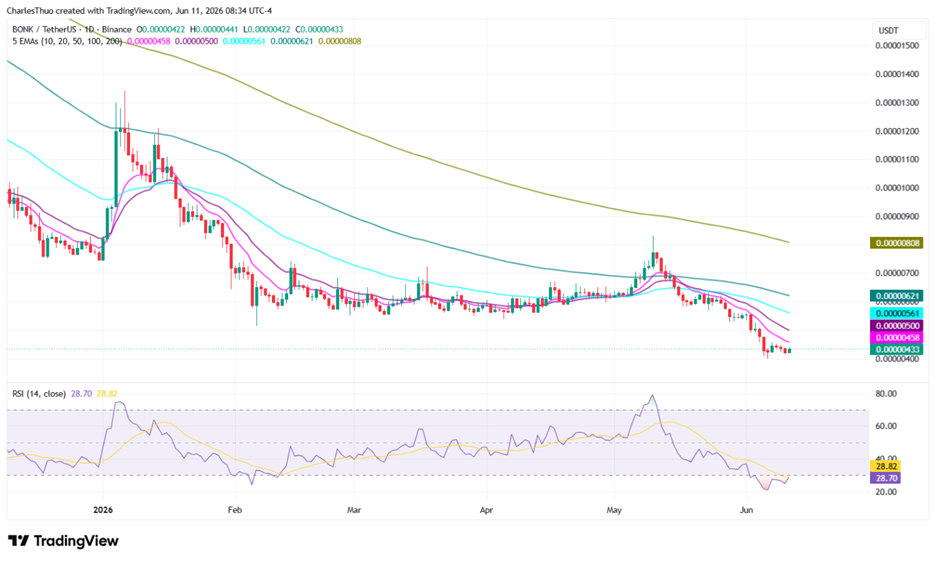
That said, the RSI picture is a bit more nuanced.
On the daily chart, the 14-day RSI has recovered slightly to 28.70 from a recent reading of 24.47, which was deep in oversold territory.
On the weekly chart, however, the RSI based on closed candles is sitting at 34.29, a level that historically indicates oversold conditions on longer timeframes.
The daily RSI bounce suggests some near-term pressure has been relieved, but the weekly reading shows that the broader trend still has work to do before momentum shifts.
The 7-day price decline of 13.7% is consistent with what the indicators are showing.
$BONK has been in a steady bleed, with losses of 13.7% over the past 7 days, 20.3% over 14 days, and 40.4% over the past 30 days.
On a one-year basis, $BONK is down 75.3% from where it was trading 12 months ago.
A macro-driven bounce, rather than a reversal signal
While $BONK coin has seen a 2.32% gain in the past 24 hours, the move came with an important caveat: it was almost entirely driven by Bitcoin.
Bitcoin rose 2.72% during the same period, and the total crypto market cap expanded by 2.06%.
The trigger was the May CPI report, which showed US annual inflation at 4.2%, matching forecasts and taking some pressure off the immediate Federal Reserve rate-hike narrative.
That macro relief lifted sentiment across the board and pulled crypto markets out of an "Extreme Fear" reading of 16 on the Fear and Greed Index.
$BONK, as a high-beta asset, simply tracked the move, and there was no coin-specific development that drove the price higher.
That matters because it means the bounce is conditional. If Bitcoin loses its footing at $62,000, $BONK is likely to follow it lower.
What to expect with the $BONK coin price in the coming days
The immediate setup is straightforward.
There are two price levels that matter most right now.
The first is resistance at $0.0000045.
A daily close above that level would place the 7-day simple moving average at $0.00000438 in the rear-view mirror and open the door to the next resistance at $0.0000056, which aligns with the 30-day SMA.
The second, and more critical, level is support at $0.0000040.
What makes the $0.0000040 level particularly significant is not just where it sits on a chart today. It is where $BONK bottomed after its first all-time high in November 2023.
A break below that floor would leave $BONK coin in open water, with the next major support level at $0.000003886.
