


 4
4
$XRP may currently be witnessing a macro confluence that could eventually push prices toward double digits if the proper conditions align.
$XRP entered the month under massive selling pressure, extending its decline and falling to a new yearly low near $1.05. Although buyers later stepped in and helped the cryptocurrency recover to around $1.11, the asset remains down 16.38% since the start of the month.
$XRP Witnessing Confluence of Bullish Technical Signals
Amid the recent weakness, well-known crypto analyst EGRAG Crypto identified what he called a growing macro confluence of technical signals that could influence $XRP’s next major move, possibly leading to an ultimate target of $27.
In his recent analysis, EGRAG pointed out that several independent technical structures currently point toward the same critical decision zone.
According to him, the convergence includes Fibonacci Circles, which he uses to track timing and price rhythm, Fibonacci Channels that show a potential expansion path, Fibonacci Extensions that establish target zones, and a falling wedge pattern showing a period of compression before a possible breakout.
He emphasized that individual indicators tend to carry limited predictive power. However, multiple signals aligning in the same area can increase the probability of a sustained market move.
Falling Wedge Structure is the Key Trigger
According to EGRAG, $XRP is currently trading within a falling wedge and also sitting inside a major Fibonacci timing window. He believes this combination is one of the most important developments on the chart right now.
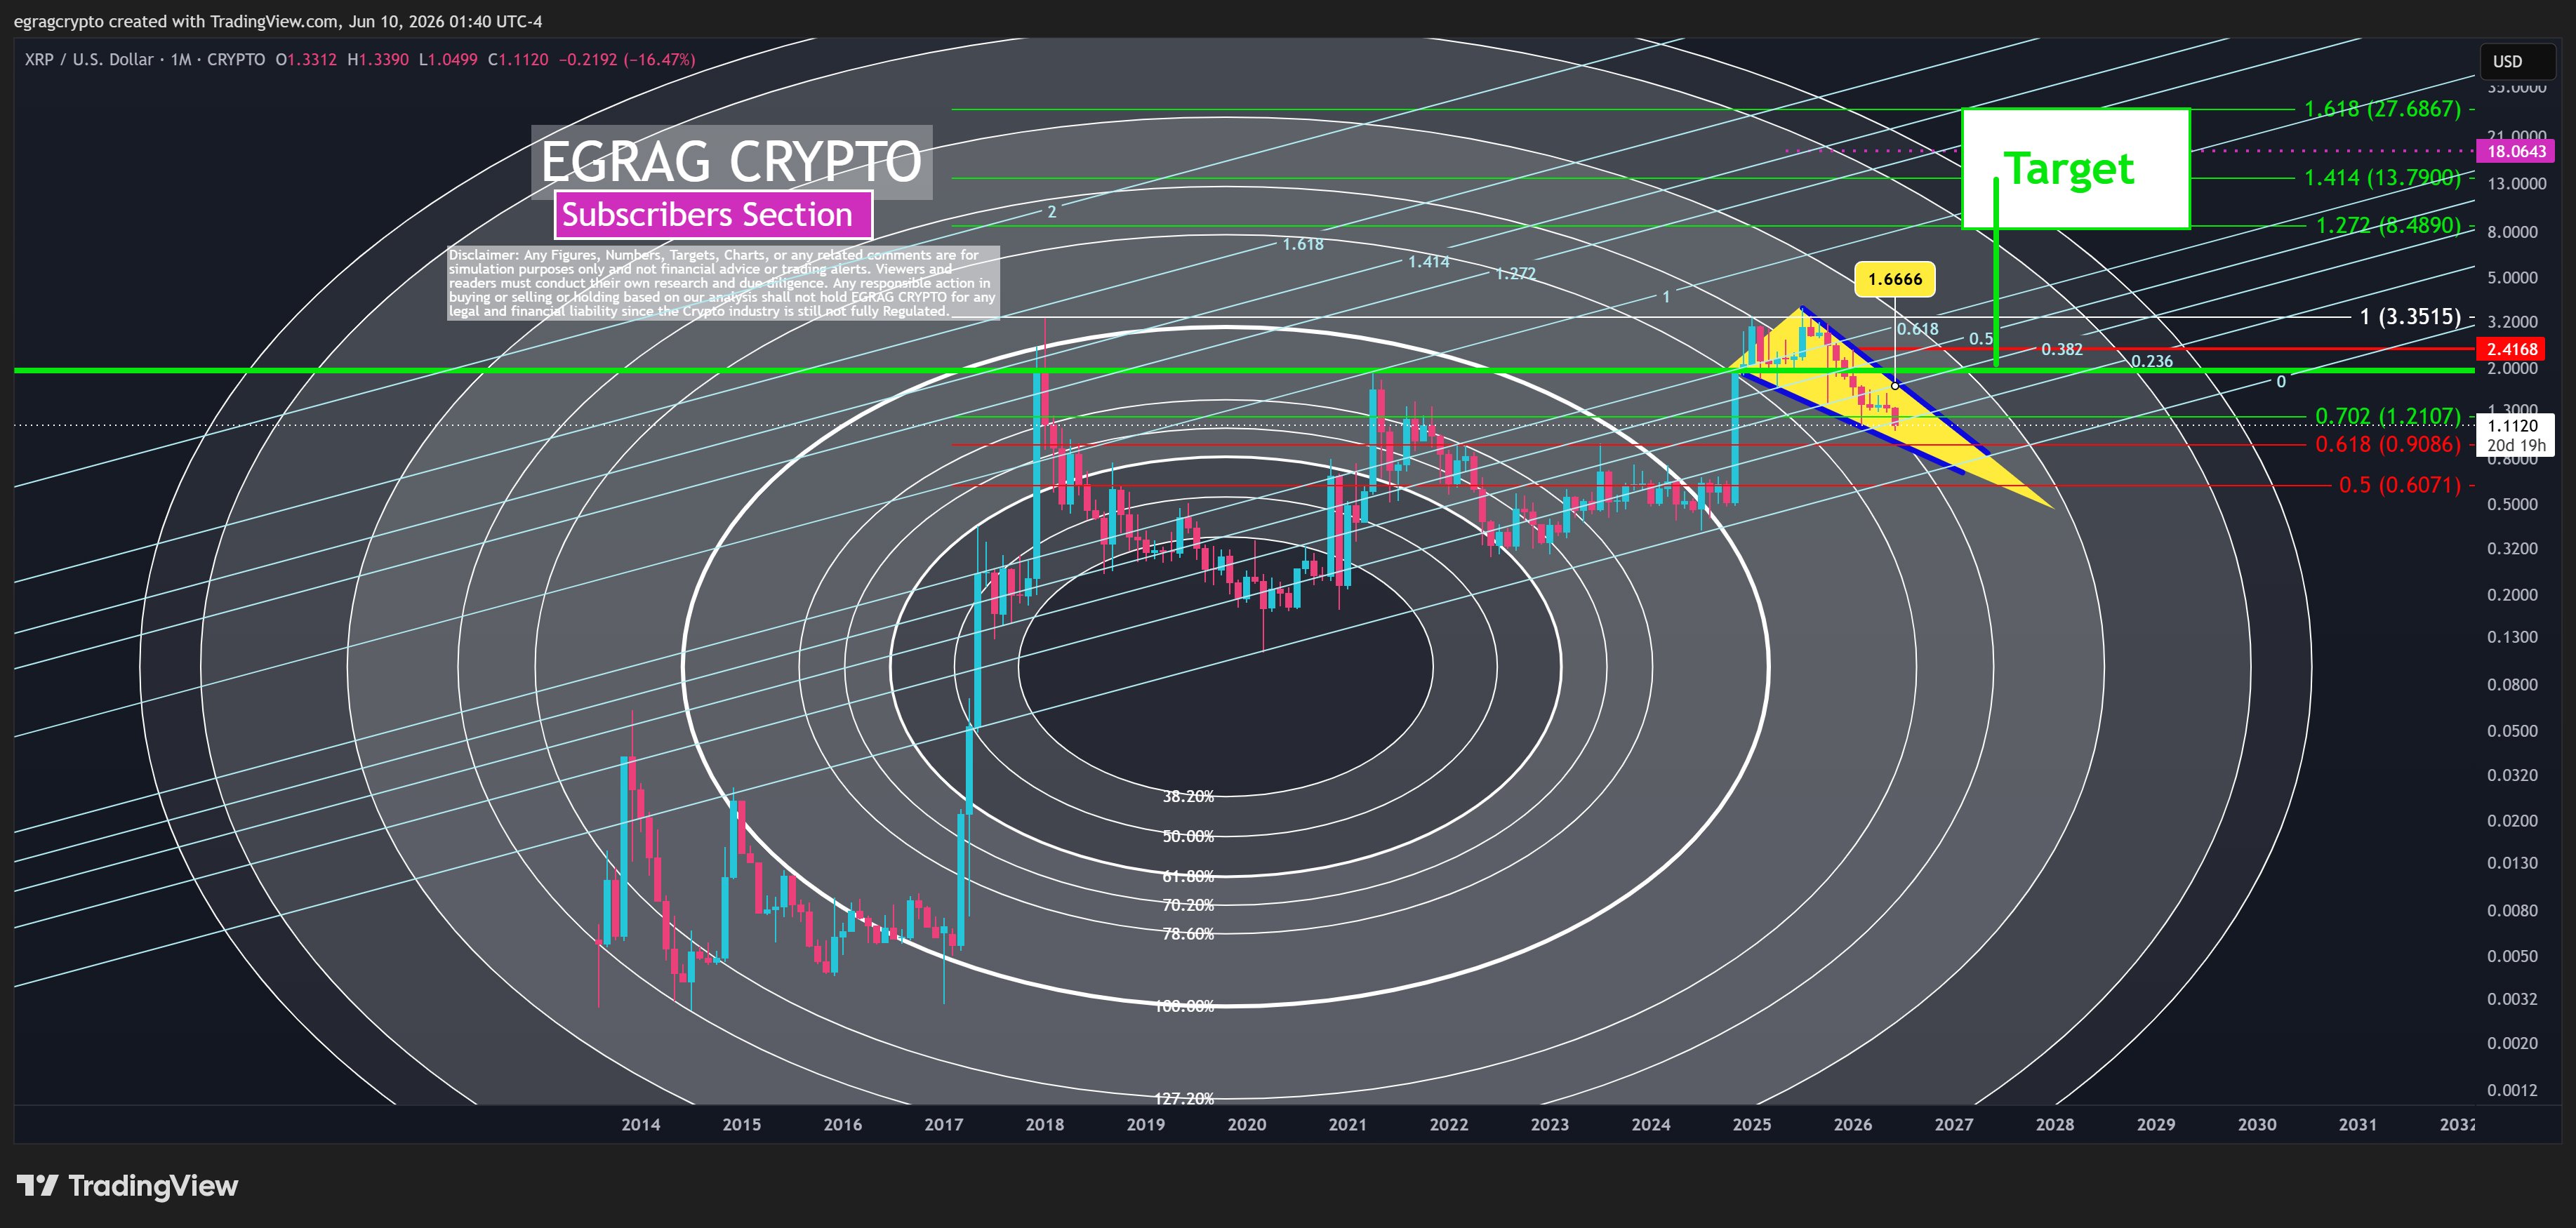
The falling wedge began forming after $XRP dropped from its all-time high of $3.60 in July 2025. Since reaching that peak, the cryptocurrency has recorded a series of lower highs and lower lows, gradually creating the wedge structure.
During late 2025, $XRP made several attempts to move above the upper trendline of the pattern. However, sellers repeatedly pushed the price back down, preventing a breakout and keeping $XRP inside the wedge.
EGRAG believes the wedge will determine $XRP’s next major move. Notably, the upper trendline currently sits around $1.66, and a breakout above this level would activate a more bullish outlook. From the current price of about $1.11, $XRP would need to gain roughly 49% to reach that level.
However, the analyst noted that touching the trendline alone would not be enough. $XRP would need to break out of the wedge and reclaim the broader $2 mark. A successful move above $2 would help the case for a larger rally and open the door to higher targets.
$XRP Fibonacci Targets Extend as High as $27.68
If $XRP completes the required breakout sequence, EGRAG believes the market could begin targeting a series of Fibonacci-based objectives. His first major target sits at $8.48, corresponding to the 1.272 Fibonacci extension level. Above that, he identified $13.70 at the 1.414 Fibonacci extension.
The analyst also highlighted a midpoint target box at $18.06 before pointing to a longer-term objective of $27.68, which aligns with the 1.618 Fibonacci extension.
Despite outlining these ambitious targets, EGRAG cautioned that traders should wait for confirmation before becoming overly optimistic.
He warned that failure to break out of the wedge could send $XRP back toward lower support levels. In that bearish scenario, the asset could revisit $1.21, followed by $0.90 and potentially $0.60.
$XRP Seeing Mixed Near-Term Signals
Meanwhile, following the recent market decline, analyst Ali Martinez reported that the Tom DeMark Sequential indicator generated a buy signal on $XRP’s three-day chart. According to Martinez, that signal suggests the possibility of a rebound after the recent weakness.
The Tom DeMark Sequential indicator has flashed a buy signal on $XRP, anticipating a potential rebound. pic.twitter.com/ZABEIx1VIW
— Ali Charts (@alicharts) June 10, 2026
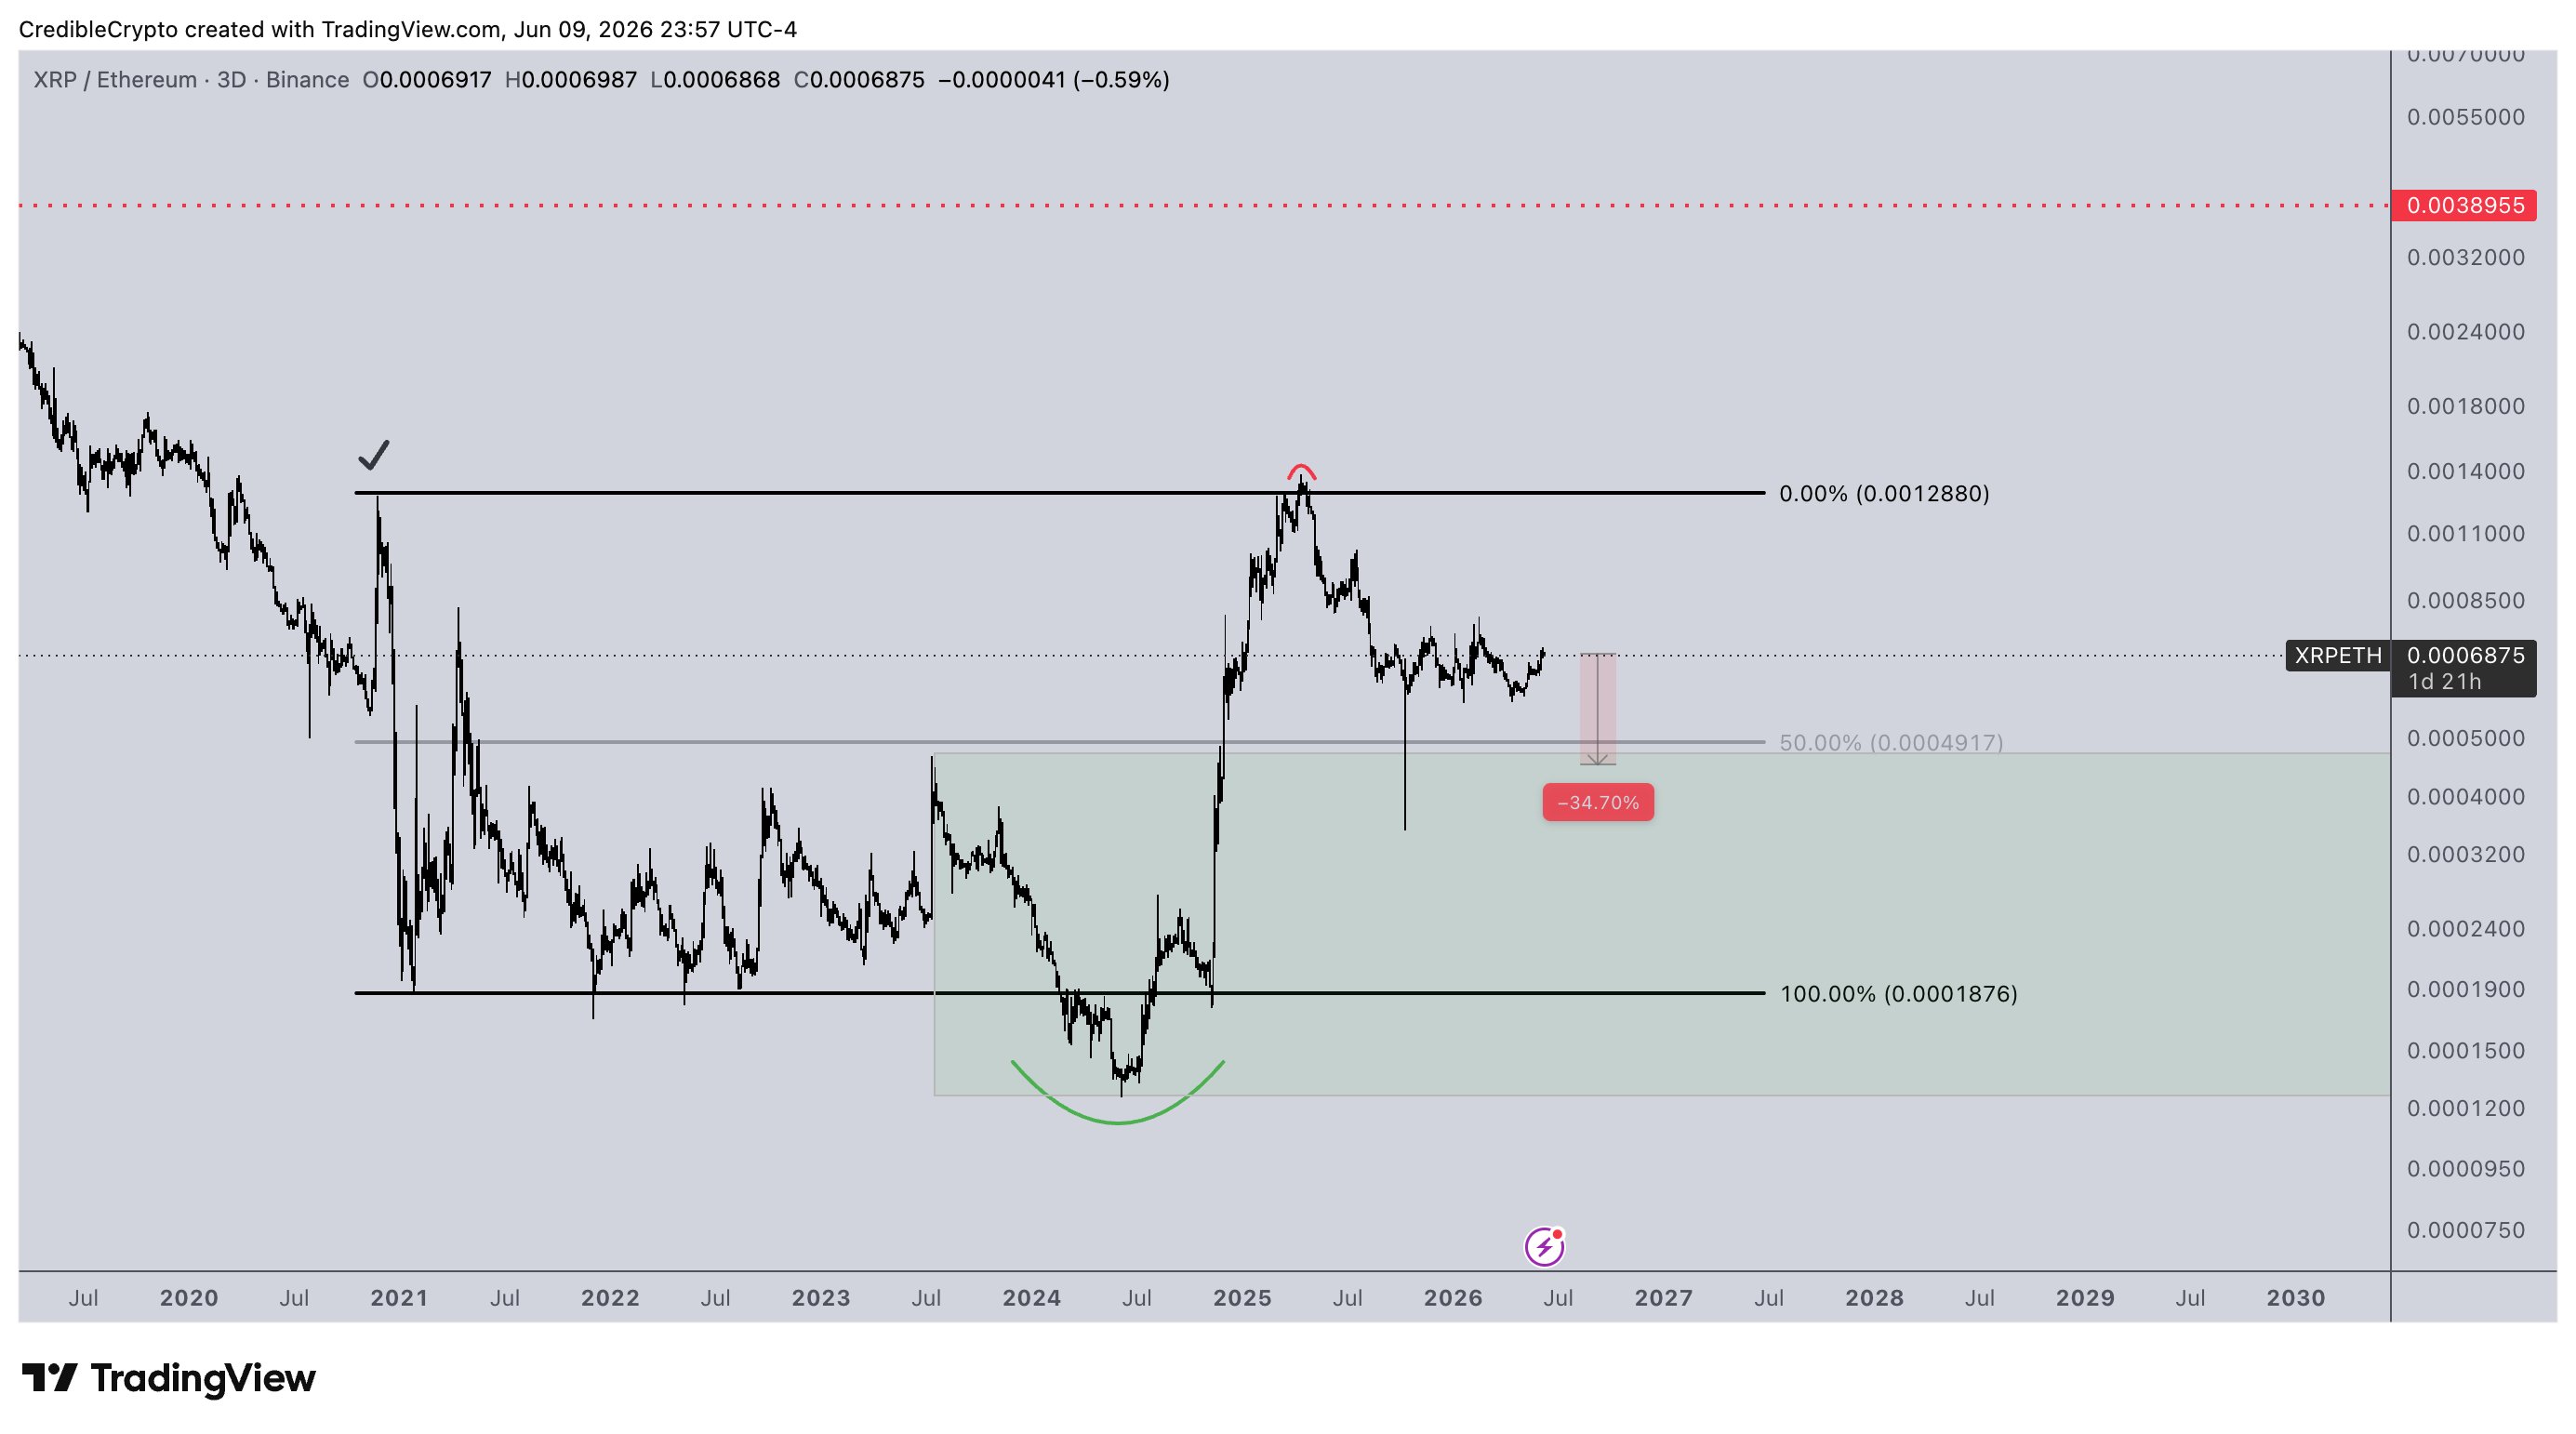
However, analyst CrediBULL stated that, in the short to medium term, the market currently favors Ethereum over $XRP until the $XRP/$ETH trading pair declines approximately 30% further and reaches at least the middle of its range.
CrediBULL also argued that $XRP/$ETH may have already established its macro bottom within the current range. To him, the pair could experience another decline of more than 30%, form a higher low, and then allow $XRP to resume outperforming Ethereum.
As a result, he sees Ethereum as the stronger choice for short-term and medium-term traders. But he maintained that $XRP has greater overall upside potential than Ethereum for investors looking to buy spot positions and hold until profit-taking opportunities emerge.

